An important part of Freetrade is speaking with Community members to see what features you’d like added.
One thing is clear.
To achieve our mission to get everyone investing, we need to plug more data into the app, so that customers can better understand, at a glance, the type of company they’re buying or selling.
Introducing fundamentals
When it comes to choosing stocks to buy and sell, you can look at a lot more than just a stock’s price to determine whether you think it’s “expensive” or “cheap”.
These numbers are often referred to as fundamentals.
The metrics we’re adding provide insights into the strength or weakness of a company and allow for comparison with different companies and sectors.

And don’t worry! You don’t need an advanced degree to dig through these numbers.
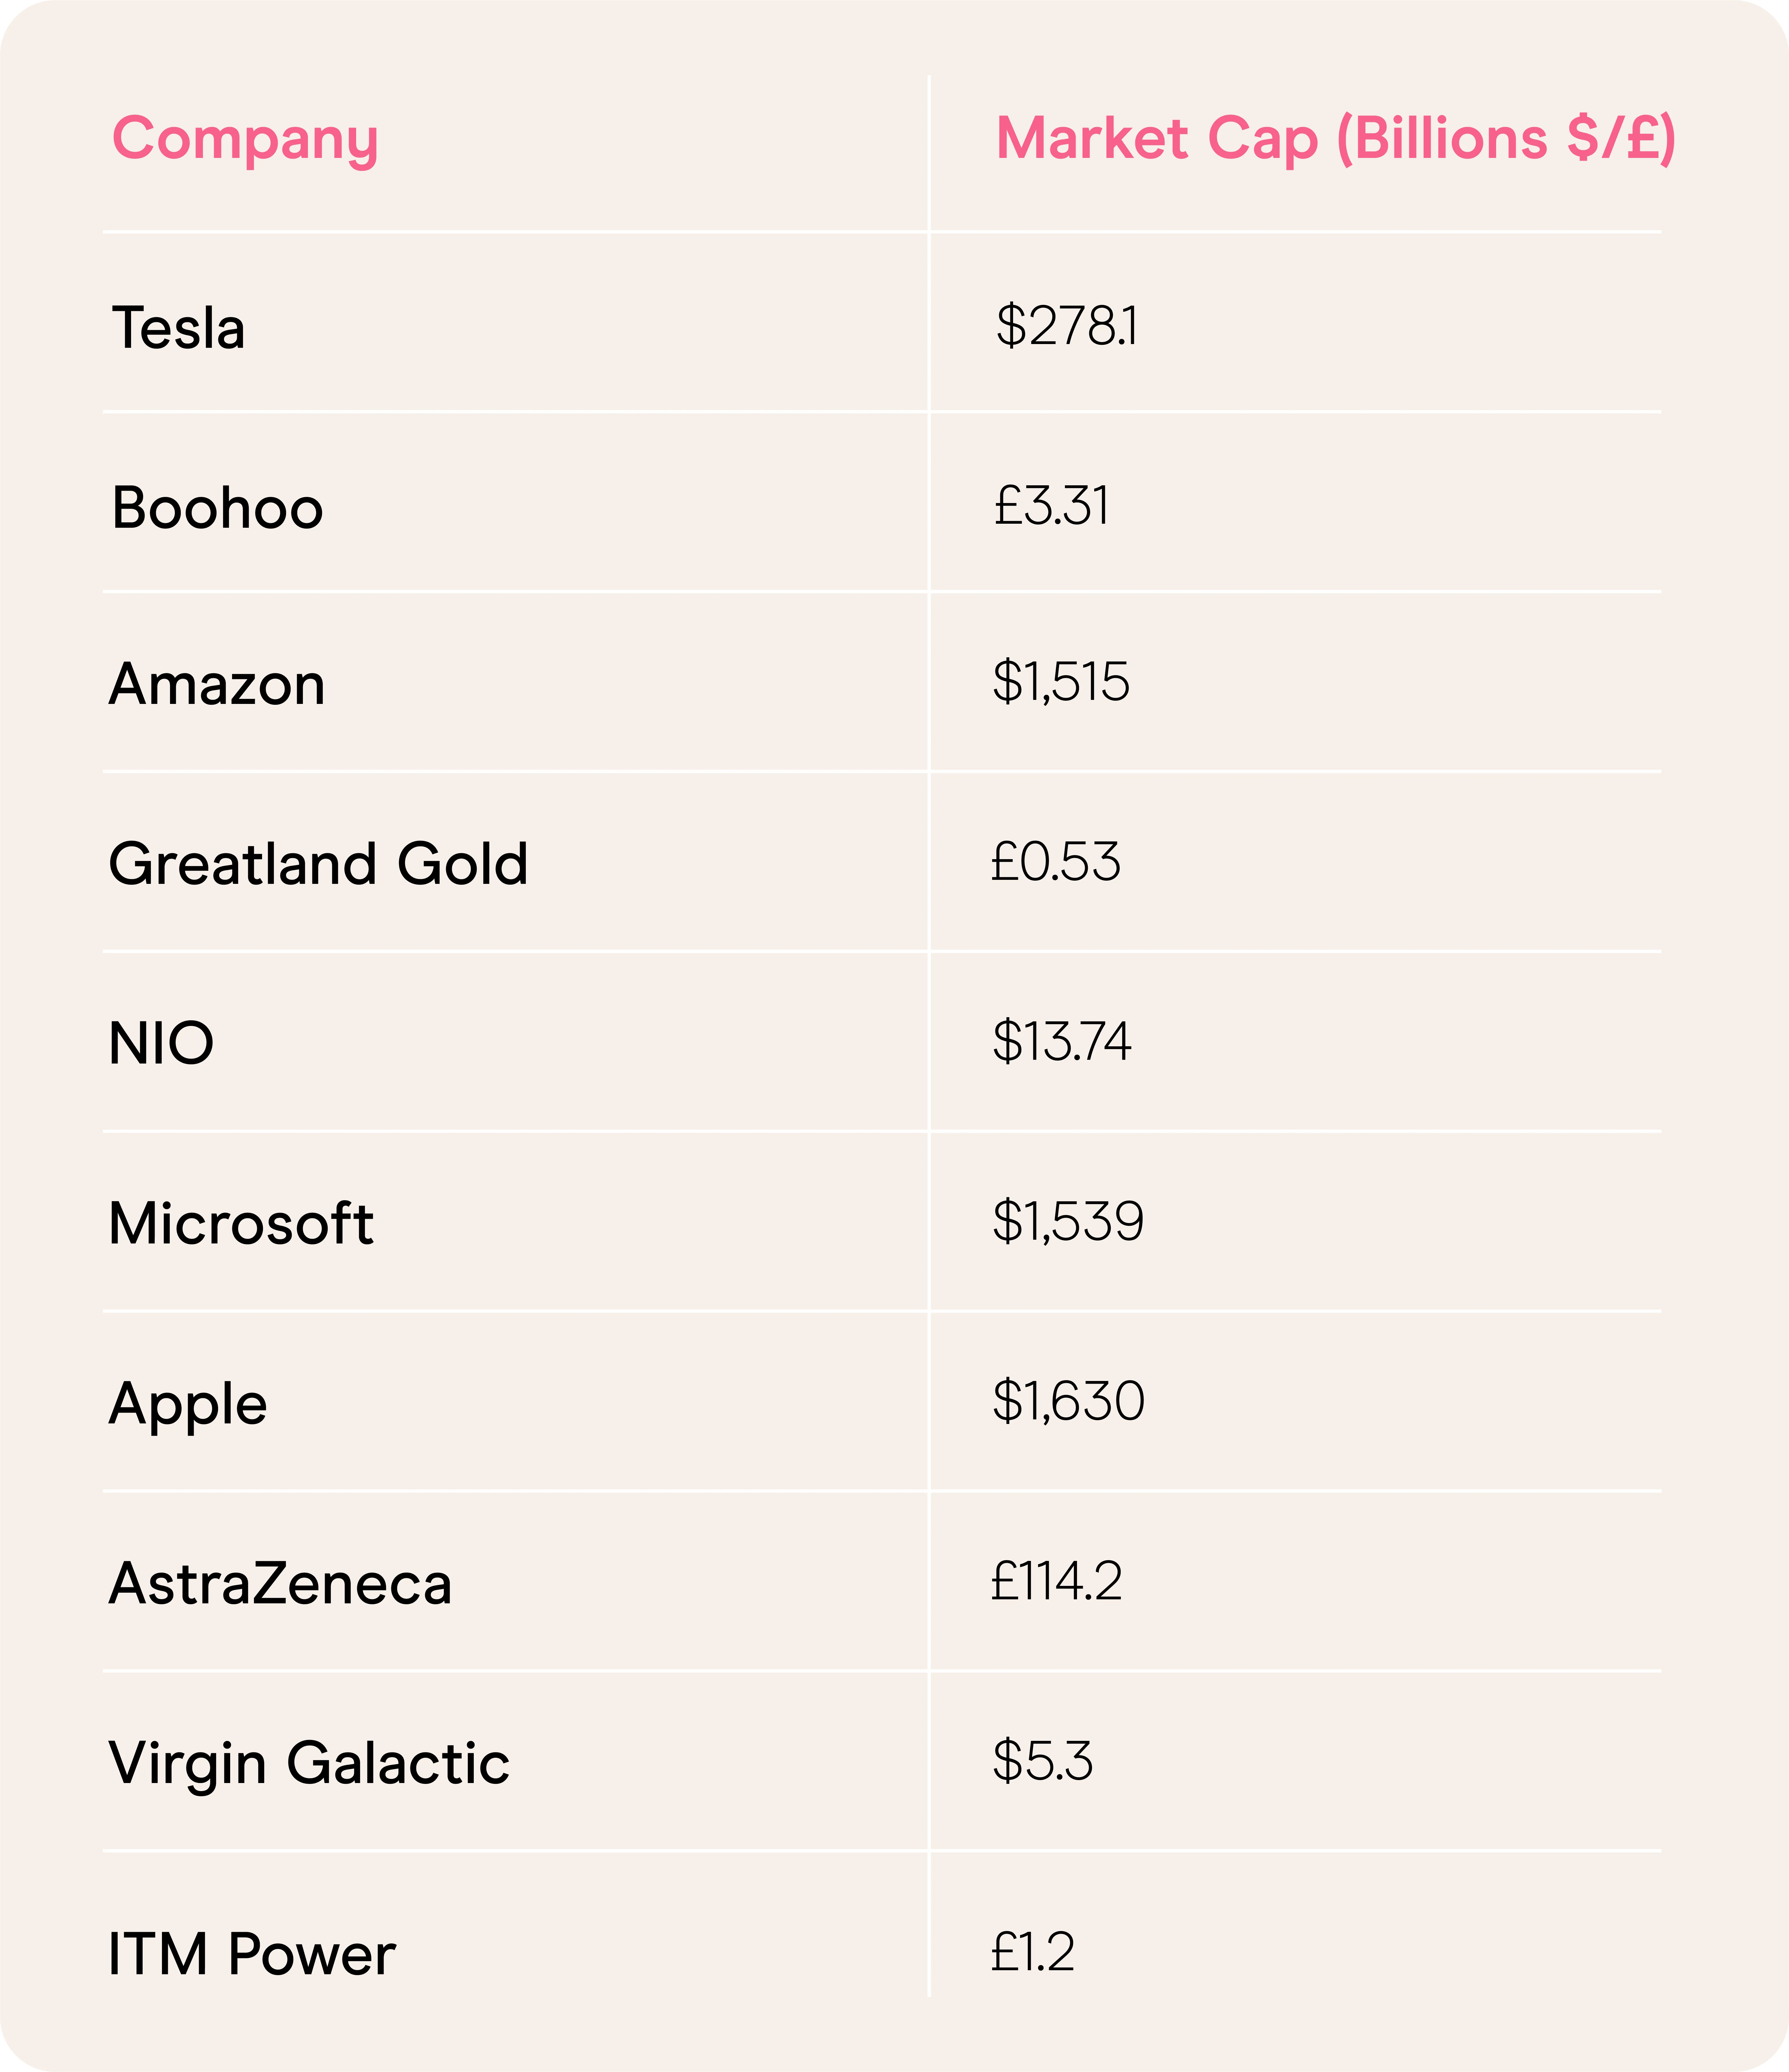
Market cap
Market cap is a phrase that you’ve probably heard thrown around a lot.
It’s short for ‘market capitalisation’ and tells you the total market value of a company’s outstanding shares.
It’s unlikely you’ll be making investment decisions based solely on a company’s market cap, but it’s still an extremely important metric to understand.
Analysts typically organise companies listed on the same stock market according to their market cap.
This holds important implications for the creation of indices and ETFs that track those indices because the weightings of individual stocks are typically related to their relative market cap.
For instance, the S&P 500 Index is a benchmark comprising the market cap weighted value of the 500 largest companies listed on US stock exchanges.
If you invest into a S&P 500 ETF, the underlying holdings of that fund will be weighted to reflect the relative size of those companies in the index itself.
As prices are always changing and, as a result, these weightings change, index providers and ETF managers rebalance these products on a regular basis (the frequency completely depends on the ETF or index in question).
P/E ratio
Next up we have price-earnings ratio or, as it appears in the Freetrade app, P/E ratio.
There are a couple of types of P/E ratio. On Freetrade, we use what’s known as a ‘trailing P/E ratio’.
This tells you how much a company’s shares cost, relative to the amount of profit it made over the past year.
For example, if a firm has a P/E ratio of 2 that means every £2 that you invest in the company’s shares corresponds to £1 in company profit. The thing to be aware of here is that it’s unlikely that a firm will make exactly the same amount of profit in the following year, meaning the ratio can be slightly misleading.
Still, understanding the P/E ratio is useful because it can give you some idea as to whether or not a stock is potentially overvalued.
If a firm has a very low P/E ratio that might mean investors are undervaluing it and vice versa.
Having said this, it’s important to remember that low P/E ratios may be an indicator that investors believe a company is going to perform poorly in the future and are selling stock.
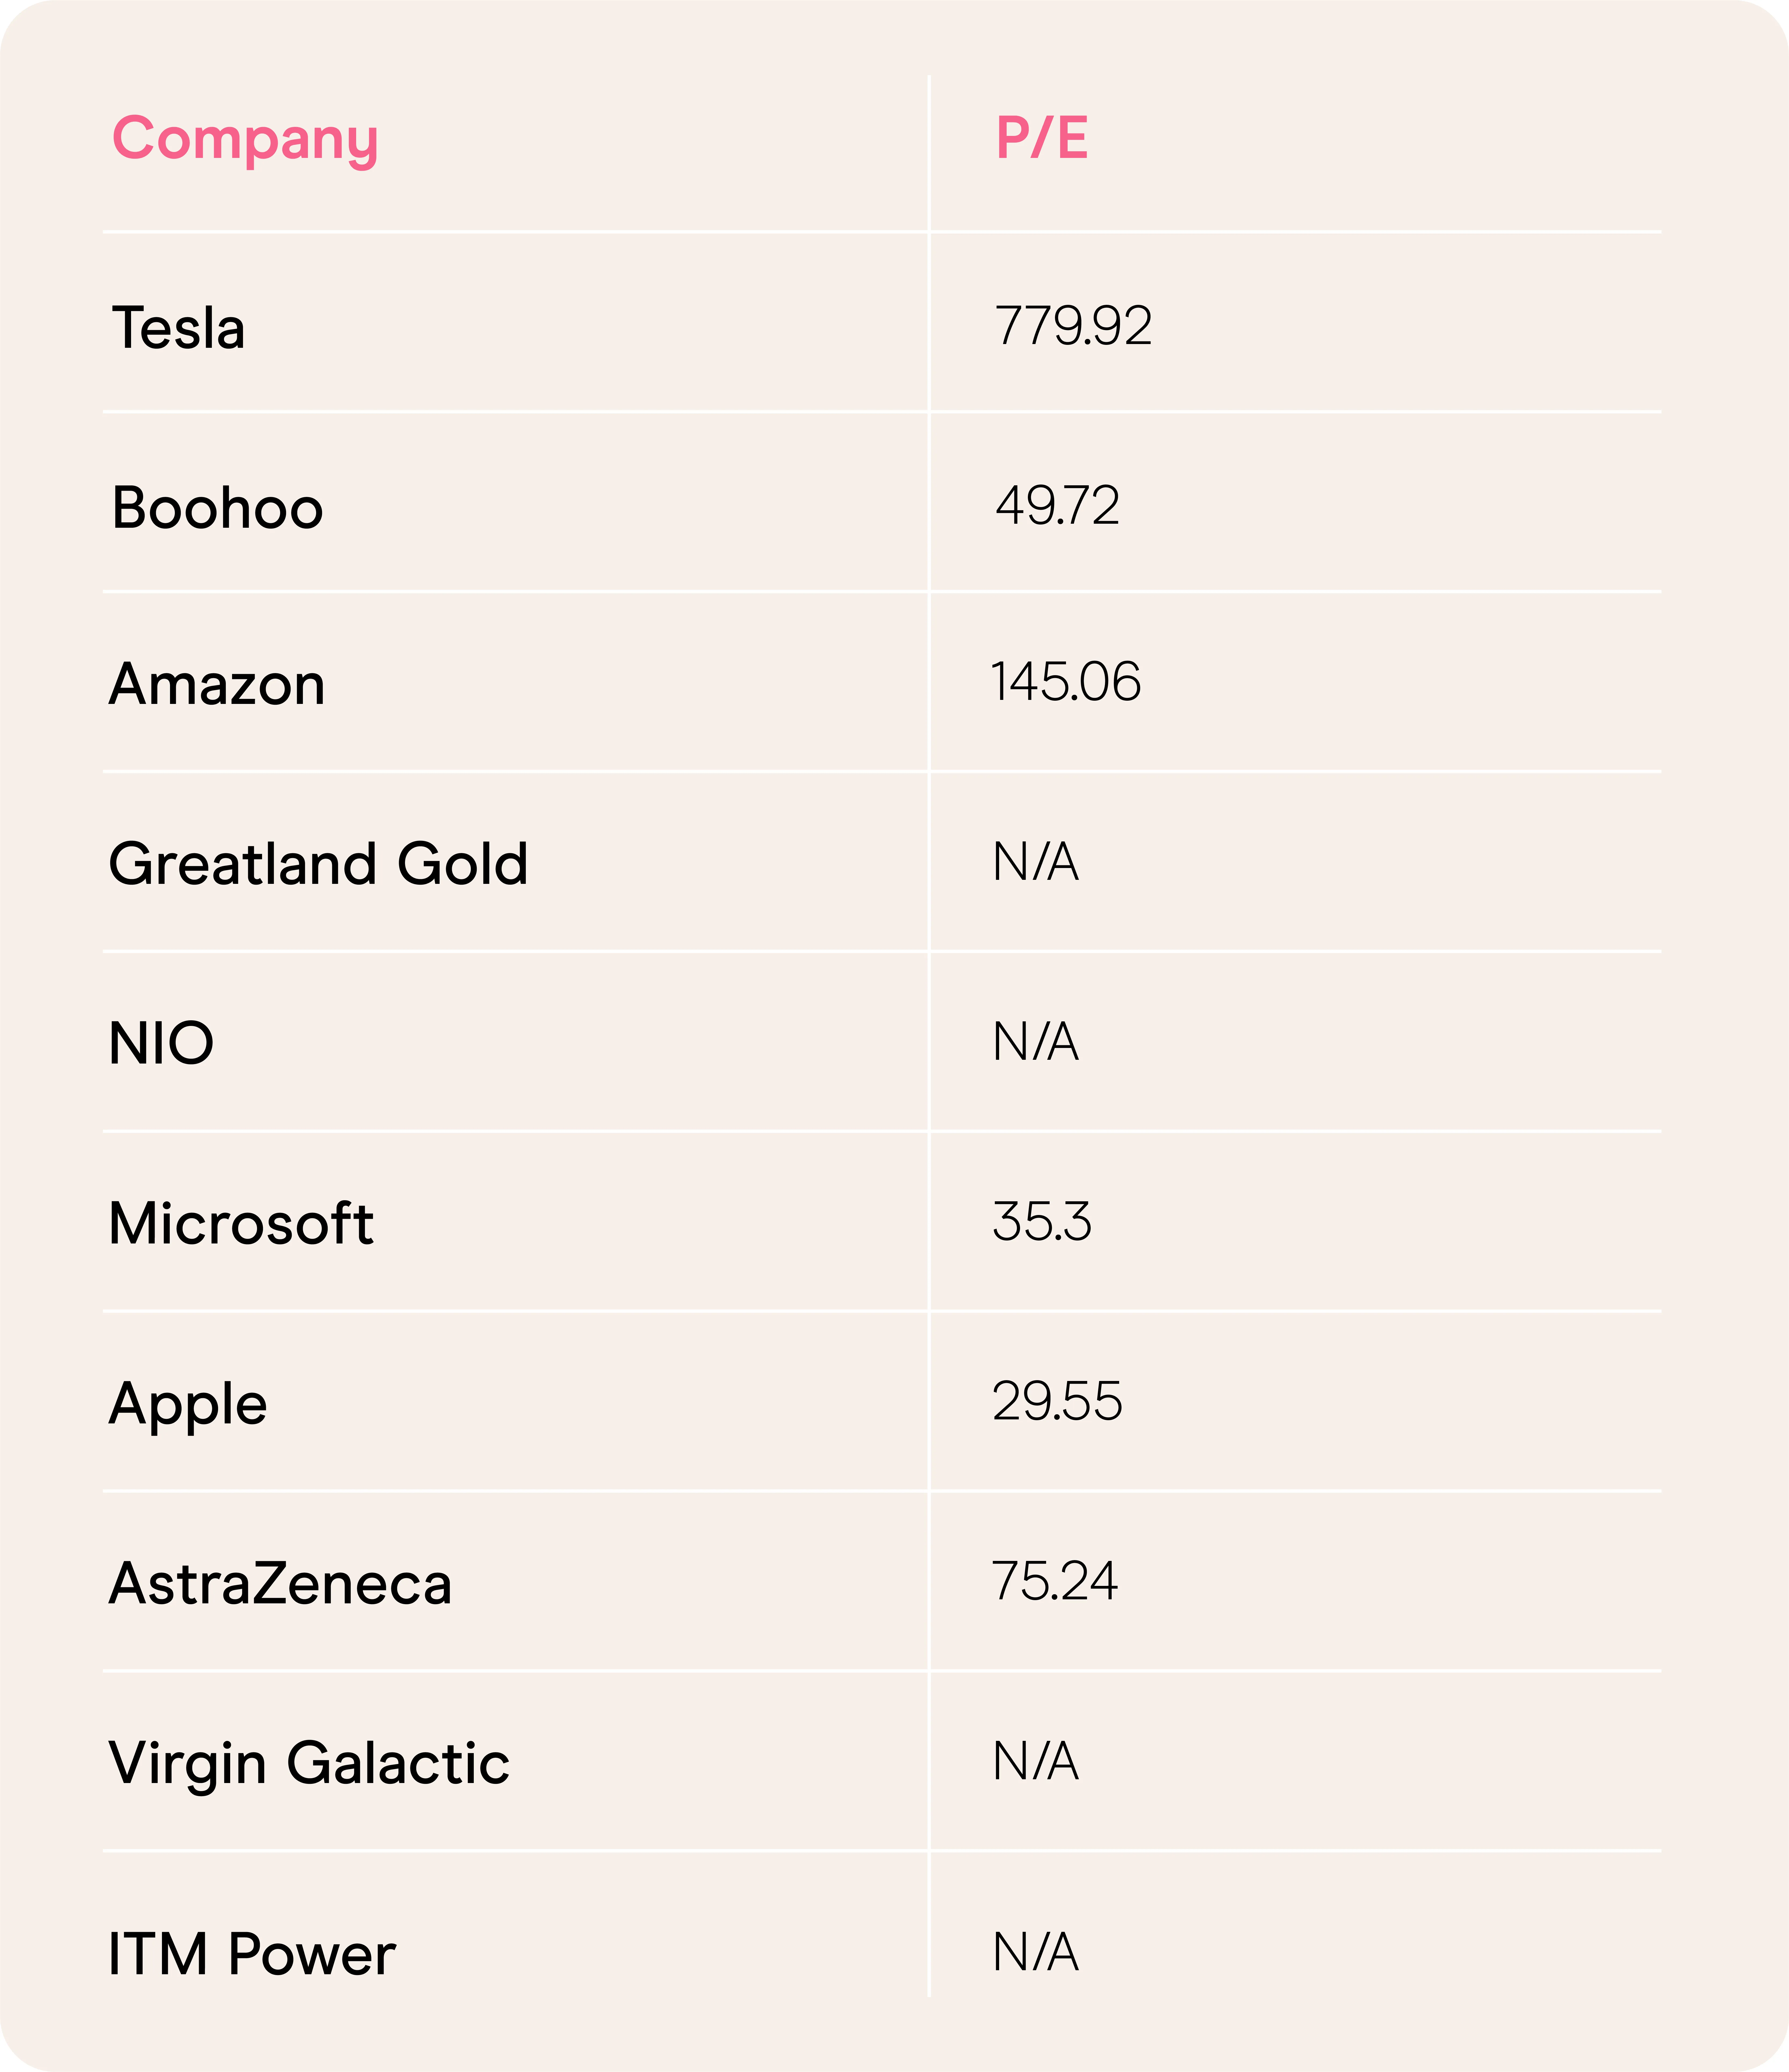
You’ll see in the table that a few stocks have a P/E ratio of “N/A”. This can mean a couple of things: either the stock is newly listed (and has yet to release an earnings report); or, the stock’s earnings per share (EPS) is negative.
Similarly, a firm may have a high P/E ratio because investors believe it will perform well in the future and are buying up its shares.
Investors tend to find it more useful to use P/E ratios to compare companies in the same sector and at similar points in their lifecycle by looking at their P/E ratios.
This helps to compare companies that might generate vastly different amounts of revenue, by focusing on the relationship between the company’s share price and its earnings.
For example, investors might compare the P/E ratios of the major UK supermarkets, whereas it is less useful to compare a supermarket’s P/E with a bank’s unless you are deliberately looking to understand differences between sectors.
Similarly, comparing an established company such as Microsoft with a relatively young and more volatile firm such as Slack is likely to be of limited use.
Dividend yield
When we recently polled Twitter asking which fundamentals you wanted to see added to Freetrade, the most popular choice was dividend yield:

The dividend yield tells you how much a company paid to shareholders for its last full-year dividend as a percentage of its current share price.
A really simple example of this would be a company that had a current share price of £1 and its last full-year dividend was £0.10. If that was the case, the dividend yield for this company’s shares would be 10%.
Having this information can be useful for investors that want to generate returns from dividends. A firm that has a stable share price and has a high dividend yield might make a good investment for these investors.
The potential problem here is that dividend yield will increase as a company’s share price decreases, so an increasing dividend yield could be a sign that a firm is doing badly.
Another point to remember is that a company’s last full-year dividend may not resemble its next full-year dividend, so you shouldn’t think that you are guaranteed to receive the same dividend payout from a company that its shareholders got last year.
More to come
Adding these metrics is just the latest improvement to your Freetrade app.
Our product team is always working to make the app easier to use and filled with all the features you need to make better investment decisions.
If you think there’s something missing that you want to see on your Freetrade app then head over to the community forum and let us know.
If you haven’t tried the app yet, why don’t you download it and try out these new features today!
This should not be read as personal investment advice and individual investors should make their own decisions or seek independent advice. This article has not been prepared in accordance with legal requirements designed to promote the independence of investment research and is considered a marketing communication.When you invest, your capital is at risk. The value of your portfolio can go down as well as up and you may get back less than you invest. Past performance is not a reliable indicator of future results.Freetrade is a trading name of Freetrade Limited, which is a member firm of the London Stock Exchange and is authorised and regulated by the Financial Conduct Authority. Registered in England and Wales (no. 09797821).