Given the relentless exuberance we’ve seen in the stock market over the past 18 months, it seems like a timely moment to remind people that share prices can actually go down sometimes.
There have been lots of discussions about ‘bulls’ since the market crash in early 2020. But that can quickly change into fearful descriptions of ‘bears’ when things start moving the other way.
The frequency with which these two animals’ names get thrown around can also make us feel a little uncomfortable about asking what the people shrieking about them actually mean when they use them.
What even is a bear market?
This isn’t an unreasonable question to ask though. In the grand scheme of things, people use ‘bull market’ to describe a period where stock prices are trending upwards and ‘bear market’ for the opposite.
Pedants may interject here and point out that the market moves up and down all the time. So does that mean we’re in a bull market if the market finishes 5% up on Monday and in a bear market if it drops 5% on Tuesday?
Not really. A more ‘official’ definition of a bull market is one in which the market rises 20%, having previously fallen by 20%. In contrast, a bear market is one in which the market drops by 20% or more.
But again, most of the time people simply use the two terms to describe broad market trends, rather than attempting to pinpoint exact market movements.
What causes a bear market?
A more interesting task to undertake, beyond figuring out what people actually mean by ‘bear market’, is understanding what causes one to take place.
Unfortunately this is quite tricky to do as there tend to be lots of reasons why stocks fall in value. If it was always the same cause, they would be much easier to predict and explain.
And even with the benefit of hindsight, actually identifying a precise set of causes and effects is hard.
Looking back over the past couple of decades, there have been three major crashes in the US and UK markets but all of them occurred for slightly different reasons.
Dot Com madness
The first was the Dot Com bubble that started in the mid-1990s and unravelled at the beginning of the new millennium.
Again, the odds are there were multiple reasons for the bubble bursting but there are generally two major reasons attributed to it.
The first was that stocks had reached mind-boggling levels. Valuations aren’t an exact science but it was becoming obvious that many firms' share prices were totally detached from reality.
For instance, in October 1999, a group of 199 tech stocks tracked by the investment bank Morgan Stanley were valued at a combined total of $450bn. Their total sales were $21bn and they made a combined loss of $6.2bn.
Read more:
I'm up 100%, should I sell?
Five tips on managing market volatility
Five things you shouldn't do when you invest
Even if that loss had actually been a profit, it would still mean those stocks were very highly valued as a collective. Such a scenario cannot continue indefinitely and when people finally realised they’d been overly optimistic about these firms’ future prospects, they began to panic and dump their holdings.
That sell off, which would see the Nasdaq lose almost 80% of its value from 2000 to 2002, may have also partly been precipitated by a change in interest rates.
Rates were hiked up six times in 1999 and 2000. Apart from being interpreted as a sign central bankers think things are getting overheated, rate hikes make it more attractive to keep money in the bank and not the stock market. If you can get good interest with a bank deposit, you’ll probably keep more money there and not in riskier equities.
Finally, rate hikes mean it’s often more expensive to raise funding and pay off debt. Both those things can make it harder to continue running a loss-making start-up than a period of easy money.
Bad loans and crashing stocks
Half a decade after the Dot Com bubble burst, the stock market took another hit when the global financial crisis began in 2007.
On this occasion it was less about optimism on the part of investors and much more to do with macroeconomic conditions.
Massive risk taking on the part of banks, mainly by giving out extremely bad loans to people who were unlikely to pay them back and then packaging them as investment products to be sold on to investors, led to a huge economic downturn.
Banks collapsed, huge numbers of people went out of work, and credit lines were harder to come by.
At what was arguably the peak of the crisis in October of 2008, when several banks collapsed, stock markets across the world saw massive drops as people sold their holdings.
What happened in 2020 again?
The last major crash of the past two decades took place in February and March of 2020.
Everyone who has spent the past couple of years as a fully sentient being will probably understand why that happened but for those not in the know, fears about the consequences of a global pandemic spooked people.
As a result, investors began to very rapidly shed their share holdings, either to buy into safer assets or to keep it as cash.
These are just three crashes and only from recent history. Dig into the past and you’ll find plenty of other examples, all driven by different factors. You could even look abroad. Iran had one of the best performing stock markets in the world until a crash last year.
What tends to tie all of them together, however, is the pattern of behaviour. Something causes people to panic and start selling which has a cascading effect as even more people panic and sell off.
Predicting is hard
Predicting when this will happen is arguably impossible. For instance, most people completely failed to predict the 2008 financial crisis and it was a pretty similar story with the coronavirus.
Even when it seems like something is likely to take place, it might be years before it actually does. Plenty of people were saying that the stock market was in a bubble in the mid-1990s. They were correct but it took a long time for it to actually burst.
Trying to figure out what to do thus becomes a bit confusing. We can say with some certainty that something will cause markets to crash but the exact trigger and when it will happen aren’t often clear.
Do nothing
One option is to simply wait it out and hope a recovery comes. Historical examples suggest this can be a sensible move to make, although there’s no guarantee things will happen in the same way again.
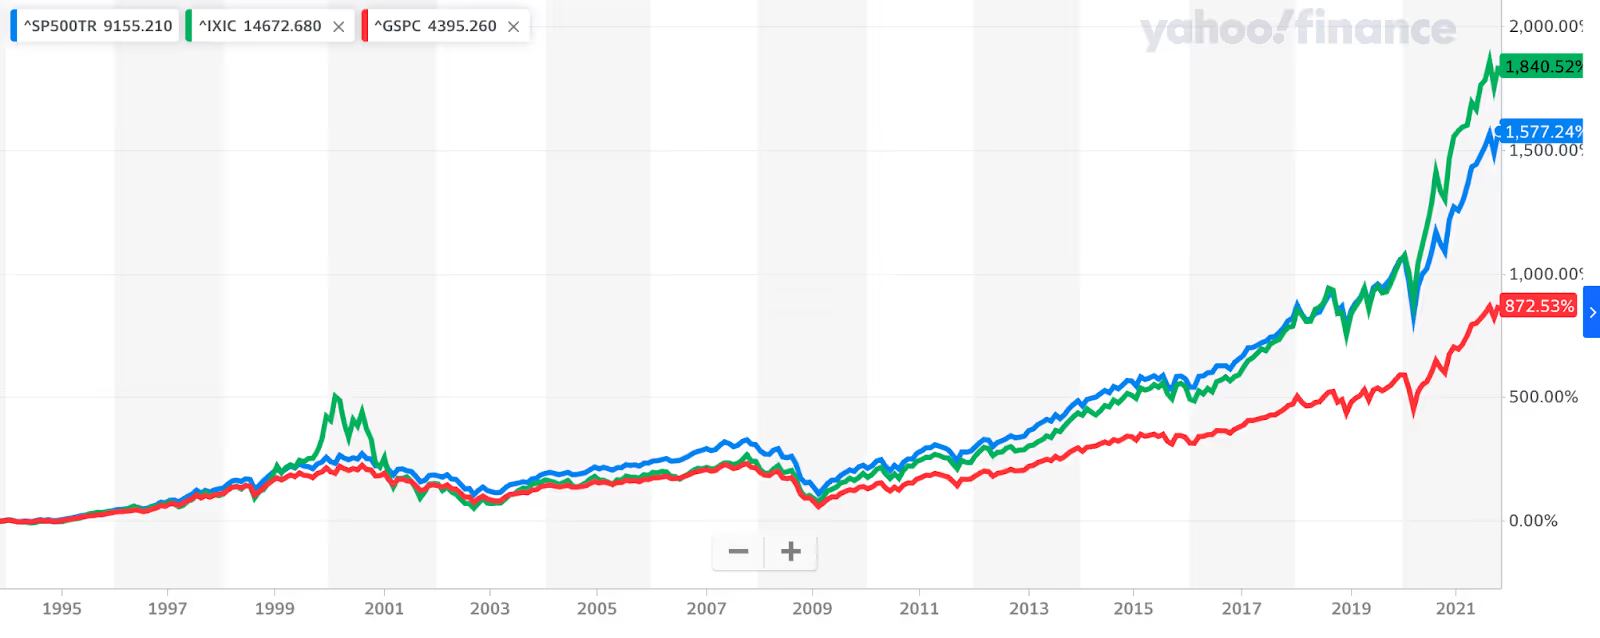
For instance, if you’d bought a fund tracking the S&P 500 at its highest point during the Dot Com boom in March 2000 and held it until today, you’d have seen a 358% return on your investment. The returns aren’t quite as strong but you’d still be well into the green if you’d bought a fund tracking any major UK indices.
A common critique of the wait and do nothing option pertains to the famous Wall Street Crash of 1929. It’s often said that it took close to 30 years for the market to recover, which is obviously a long time to wait just to break even.
The reality is a bit more complicated. When you factor in dividends and a stronger currency, it’s more likely it would’ve taken seven years for investors to break even if they had bought at the 1929 peak.
Similarly, in the UK, investors often believe the UK’s 100 largest-listed firms have barely moved since the start of this century. Factoring in reinvested dividends means you actually got a return of close to 160%.
A fairer critique would be to say that this may not happen again or that it could genuinely take a very long time to recover in the future. Moreover, if you are reaching retirement, waiting a decade to get your money back probably isn’t a great option.
Diversify
These are valid points but luckily we can take steps to try and mitigate the risk they pose.
Ultimately, this comes down to that most mundane but valuable piece of investment advice: diversify.
This may seem like a dumb thing to suggest given we’re talking about a market crash, not individual companies, but crashes often hurt some firms much more than others.
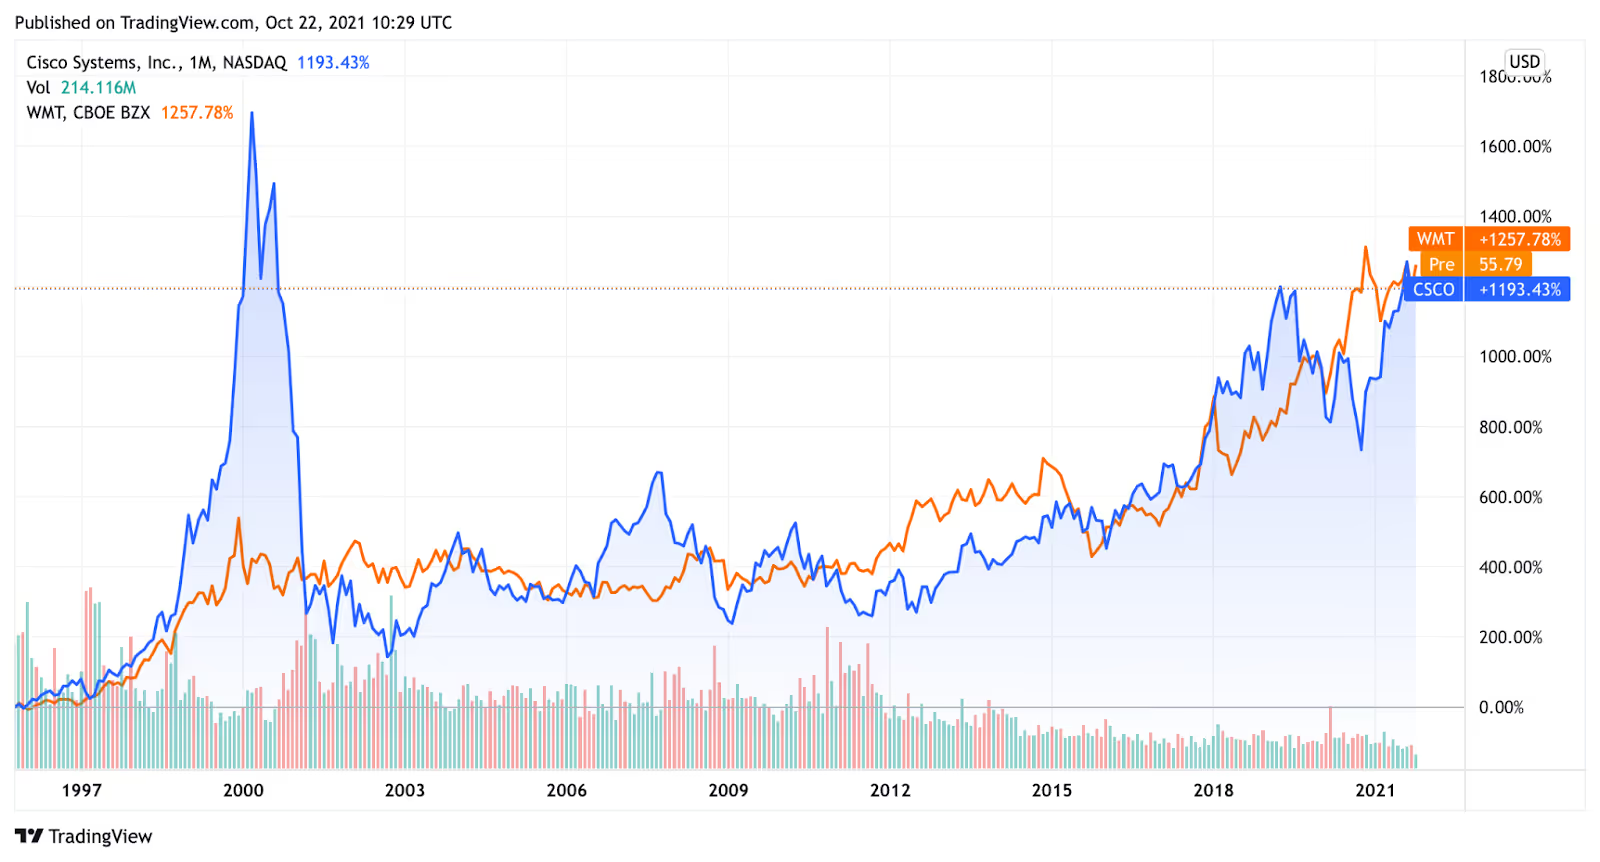
For instance, much of the market’s ire in the Dot Com crash was focused on insanely high value tech companies. Contrast that with a supermarket like Walmart, which didn’t thrive during the crash but also didn’t see any of the massive drops that internet firms did.
Similarly, banks and financial services firms took much bigger hits than other businesses in 2008. Google owner Alphabet, on the other hand, saw some declines but then recovered fairly quickly.
Another thing to consider here is that diversification doesn’t just mean buying different stocks. Other asset classes, like gold, bonds, and even cash are all worth holding on to.
In fact, cash is arguably the most important thing to have in a crash because you can often swoop in to buy stocks that have been unfairly punished by people panicking.
Keep calm and carry on
Whatever you choose to do, you ultimately have to accept that bear markets are going to occur and the odds are you’ll be hurt by them to one degree or another.
Avoiding this entirely would basically mean holding your money purely in cash (although then you’d be subjecting yourself to the slow death of inflation.)
Like that annoyingly overused WWII poster, the best response is to keep calm and carry on. Buying at the top and selling at the bottom has never been a wise move to make.
Freetrade is on a mission to get everyone investing. Our stock trading app makes it easy to buy and sell a wide range of investments, including stocks, ETFs, investment trusts, REITs, SPACs and even newly launched IPOs. Take a look at the most traded shares on the platform to see what retail investors buy and sell weekly. Download our iOS trading app or if you’re an Android user, download our Android trading app to get started investing.
This should not be read as personal investment advice and individual investors should make their own decisions or seek independent advice. This article has not been prepared in accordance with legal requirements designed to promote the independence of investment research and is considered a marketing communication.When you invest, your capital is at risk. The value of your portfolio can go down as well as up and you may get back less than you invest. Past performance is not a reliable indicator of future results.Freetrade is a trading name of Freetrade Limited, which is a member firm of the London Stock Exchange and is authorised and regulated by the Financial Conduct Authority. Registered in England and Wales (no. 09797821).


.avif)