-min.avif)
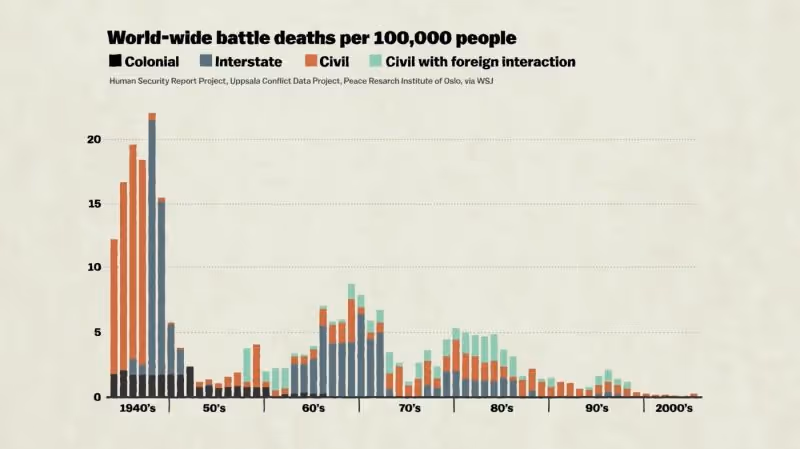
Scrolling mindlessly through the internet a couple of weeks ago, this author stumbled upon a rather peculiar graph.
It showed all of the fatalities from war, per 100,000 people, from the start of World War II until the present.
The person posting this graph claimed this ‘proved’ war was on the decline.
Samurais and false reasoning
The flaws in this reasoning seem so self-evident that it almost feels pointless to elaborate upon them, but elaborate we shall.
Fans of the TV show Samurai Champloo may be familiar with the Tokugawa period in Japan.
Lasting from the early 1600s until the mid-1800s, it was a fairly stable and, more importantly, peaceful period of Japanese history, complete with samurai leaders and lots of Kabuki theatre.
In fact, if you were there at the time you could have concluded that war and foreign invasions in Japan were a thing of the past.
Obviously that wasn’t true. In 1853, American ships rolled into Tokyo Bay and changed the course of the country’s history forever (a story for another Weekend Read).
Don’t be a turkey
The point to draw from this is it’s very easy to take what is really a temporary phenomenon and then conclude it’s going to continue onwards forever.
As the author Nassim Taleb has written, a Christmas turkey, being well-fed and cared for, has every reason to believe its life is going to be one long bout of taking it easy.
Then it suddenly has its head chopped off and ends up on someone’s kitchen table.
Unfortunately, we investors often end up behaving a lot like that turkey, whether it's by slavishly following specific fund managers or buying into hot stocks.
When the bubble bursts
Take Garrett Van Wagoner as an example.
The odds are you’ve never even heard of the guy but Van Wagoner was one of the most celebrated fund managers of the late 1990s, even if he does sound like a George Costanza alter-ego.
He had several high-performing years and then smashed things out of the park in 1999 by delivering 291% returns for his fund. That prompted a huge inflow of cash, with assets under administration growing from $189m to $1.5bn in the space of a year.
Then things went downhill as the Dot-Com bubble started to burst. The fund dropped in value by 21% in 2000, 60% in 2001, and 65% in 2002.
As you can imagine, this meant a lot of people got burned. It also provides a good example of what can happen if you end up believing past performance shows the good times will last indefinitely.
Not just hindsight
Van Wagoner supporters (if there are any left) may point out that it’s easy to look back in hindsight and say it was obvious how things would end up. There’s probably an element of truth to that.
But the fund manager was featured in a 1997 documentary about the stock market and many of the people commenting on the show were saying then, years before the crash, how precarious it all seemed.
Read more:
Is Tesla sparking EV mania?
Stock bubbles and the spectacle
When diversification is dangerous
Watching Van Wagoner in the documentary is also surreal. Again, it may be seeing things with the benefit of hindsight, but he seems to have invested, if that’s even the right word to describe what he was doing, like a pre-Reddit member of Wall Street Bets.
What that suggests is a lot of investors piling money into his fund were happy to ignore the red flags they saw in the present because they were so overcome by topline performance numbers from the past.
“Don’t you wanna be cool?”
Part of the difficulty with not behaving like this is that, much of the time, past performance builds hype that then continues to increase asset prices.
For instance, in the mid-90s Iomega stock rose from $0.67 to $150 before losing about 98% of its value.
This didn’t happen overnight. It took place over a few years, during which many people branded themselves “Iomegans” and trashed anyone who didn’t believe that the stock was going to do well (sound familiar?).
As our brains are wired to see instant results, it can be really hard to sit on the sidelines and wait for years before something like Iomega unravels.
You’ll have to watch as its price goes up and listen to everyone telling you, like teenagers trying to apply peer-pressure, what an idiot you are for not jumping on the bandwagon.
Do it your way
The easy way to avoid this is to ask what the actual valuation is being driven by.
Whatever way you choose to value a stock, whether it's looking at its growth prospects, profit margins, price-to-earnings ratio, book value, or some combination of these and other data points, you can end up with some idea as to what you’d be happy to pay for it.
Past behaviour may provide some insights here. You may see that a company is well-managed, for example, or like its focus on maintaining high margins.
But looking purely at its price performance, and how much it has moved up and down over a set period of time, doesn’t really tell you anything.
That may seem like an incredibly simple point but when there’s lots of people screaming about how amazing a company is and you’re watching its price skyrocket then it can be easy to forget.
Avoiding the temptation to do so may mean taking some heat from the true believers. But when everyone else ends up looking like that Christmas turkey, you’ll probably feel a lot better than they do.
Have you ever made any past performance-inspired mistakes? Let us know in the Freetrade community forum:

Freetrade is on a mission to get everyone investing. Whether you’re just starting or have loads of experience, you can buy and sell thousands of UK and US stocks, ETFs and investment trusts commission-free via our trading app. Download our iOS trading app or if you’re an Android user, download our Android trading app to get started investing.
This should not be read as personal investment advice and individual investors should make their own decisions or seek independent advice. This article has not been prepared in accordance with legal requirements designed to promote the independence of investment research and is considered a marketing communication.When you invest, your capital is at risk. The value of your portfolio can go down as well as up and you may get back less than you invest. Past performance is not a reliable indicator of future results.Freetrade is a trading name of Freetrade Limited, which is a member firm of the London Stock Exchange and is authorised and regulated by the Financial Conduct Authority. Registered in England and Wales (no. 09797821).


.jpg)


.webp)

.avif)