Investing through market corrections can feel uncomfortable, so it's a good idea to get a better understanding of what they are, what causes them, and the different shapes and sizes they come in.
What is a stock market correction?
A stock market correction is when an index like the S&P 500 falls by 10% or more.
During corrections, plenty of individual stocks fall by more than 10%. For investors in those companies, corrections can feel a lot more painful than the 10% technical definition suggests.
Recent market declines, including the pandemic collapse, tend to happen at lightning speed and can be unnerving.
The market can flit from calm to turmoil and back again all before the real world has come to terms with whatever it was that caused the selloff in the first place.
On that note, everyone wants to know what causes big corrections and if there will be a stock market crash this year, but there are no hard and fast rules to it all.
Each correction might look different to the ones that went before and be the result of completely new provocations.
Probably the only common feature is that they are all unique.
A bear market goes beyond a technical correction. It happens when the selloff tops 20%.
Wedged in between the global financial crisis of 2008 and the pandemic, there were four corrections of more than 10%. But none of them tipped into bear market territory.
And if you’re wondering where it gets its grizzly name from, legend has it it’s because a bear attacks with a downward swoop of its paw. A bull, on the other hand, gets its horns low and gores in an upwards direction.
That’s the bull market vs bear market jargon explained. See, every day’s a school day.
Read more: Investment risk explained
Past performance is not a reliable indicator of future returns.
Source: Koyfin as at 31 Jan 2022. Basis: in local currency terms with income reinvested.
When was the last market correction?
Leaving aside this year’s stock market pullback, the last market correction was the panicked selling of Feb / March 2020. Investors realised Covid-19 wasn’t going to be contained within China and that we had a global pandemic on our hands.
It caused a market collapse vastly different to any other in living memory.
For one, it was a global health crisis, and no one had any experience of what to do when global economies are forced into lockdown. Investors were asking questions like, “what happens if my companies lose an entire year or two of revenues?”
It was dramatic in its speed too. The S&P 500 (a US market index) went from peak to trough, losing a third of its value, in a little over a month. Investors couldn’t sell fast enough. By August, after rallying 50% off the bottom, the S&P 500 was back to its all-time high, as if nothing had happened.
This all took place while the majority of the world was still coming to terms with on-and-off lockdowns and a “new normal”.
These types of market corrections are only supposed to happen once in a generation. But investors with more than 15 years’ tenure would beg to differ.
Thankfully, though, they are not the most frequent sort of market pullback.
Read more: How to invest through a black swan event
How a correction works
While corrections, bear markets, and crashes all have vastly different characteristics, the reasons why they happen can be narrowed down.
We think there are roughly three types of correction.
1. Bursting of an excess-fuelled stock market bubble
These falls tend to be the largest, and have significant consequences. There have been two in the last 25 years and both have had long-lasting effects.
The root causes of bubbles are varied and complex, and are sometimes hard to identify because they originated way before the real problems surface. The global financial crisis, for example, was caused by banks lending mortgages to people who couldn't afford to repay them.
This went on for years before it turned into the complex financial-instrument Wall Street frenzy that it’s famous for.
The roots of the tech bubble can be traced back to the very early days of the internet in the 80s and early 90s. By the time the markets were partying like it's 1999, companies were going public with no revenue but an enticing .com at the end of their names.
Despite their varied causes, a common feature is that the stocks that go up the most during the bubble excesses tend to be the ones that fall the hardest and take the longest to recover.
When the dot com bubble of the late 90s popped it took nearly eight years for the market to regain its lost territory. The technology sector, though, suffered a more intense and longer-lasting hangover.
Microsoft, now the world's second-largest company, didn’t return to its 1999 high until 2017.
And it was a similar story for bank stocks during and after the global financial crisis. When the credit-fuelled property bubble burst in 2008, it took global government intervention to avert mass bankruptcy in the banking sector.
Although the S&P 500 had returned to highs by 2013, Wall Street bank Goldman Sachs, a major player in the credit crisis drama, was still recovering 10 years later.
And other major money centres like Citigroup are arguably still reeling from the crisis.
A feature of these bubbles and their subsequent bursting is that they always seem obvious in hindsight. Most investors are fully aware that frenzied markets tend to end badly, and that it's a game of musical chairs. They just hope to be firmly placed in a seat when the music stops.
Bubbles can also go on a lot longer than you might think. Famous investors that ‘called’ the housing bubble started betting against it five years before most investors started to smell a rat.
“Markets can stay irrational longer than you can stay solvent” John Maynard Keynes
But when the bubble finally bursts, things can get very ugly very fast.
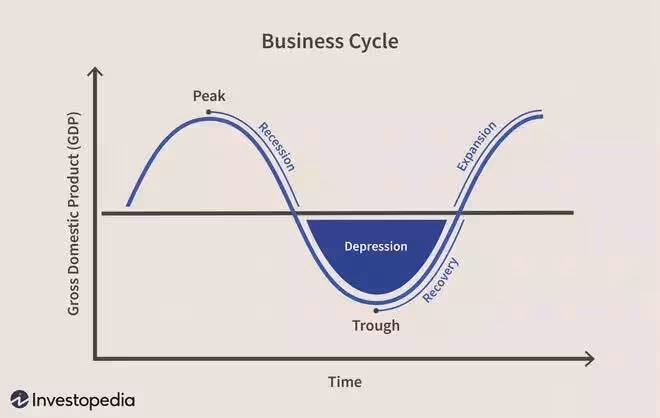
2. End of a business cycle
In macroeconomic theory, business cycles play out in an orderly fashion. Economies and companies have a nice run and unemployment falls to low levels. Companies then have to start paying higher wages to attract workers, and this feeds into greater demand. This forms a feedback loop that leads to higher prices and creeping inflation.
Central bankers and governments jump into action and try to cool the economy through tightening policy and raising interest rates.
This leads to a period of slowing growth. At some point interest rates reach a level where it is unattractive for companies to borrow and invest, and for consumers saving becomes more appealing than spending.
The slower economy starts to flatline and slips into decline. Policymakers reverse their rate hiking and move into lowering mode.
At some point, rates are low enough to entice businesses to borrow and invest and consumers decide spending is better than saving. And the cycle is complete.
The whole cycle might take five to seven years. But to find examples you’d have to delve deep into the archives. The reality is that it just doesn’t work like this anymore.
And for markets, we’re not sure it ever did. Stocks tend to experience long multi-year periods of uptrends interrupted by sharp (sometimes very sharp) declines.
That said, the fall in late 2018 looked a bit like a business cycle correction. Investors had become concerned that the US Federal Reserve was going too fast with rate rises, and a correction ensued.
Normal service resumed in 2019, though, when policy setters backed away from their hawkish (meaning keen to raise rates) tone. The S&P 500 posted a strong gain for the year.
The key thing to remember with this type of correction is that markets are forward-looking. They don’t sit around and wait for economies to turn before falling. They will correct in anticipation of turns, sometimes accurately, but other times prematurely.
In the middle of the credit crisis, Warren Buffett was loading up on US stocks. At the time he said, “If you wait for the robins, spring will be over”. His comments referred to trying to time the bottom of the market. But the sentiment holds at tops too.
3. Valuation overshoot
“In the short-run, the market is like a voting machine - tallying up which firms are popular and unpopular. But in the long run, the market is like a weighing machine - assessing the substance of a company.”
— Benjamin Graham
Valuation corrections tend to happen in disguise. “Stocks sold off because they got a little bit too expensive” doesn’t make for a good headline or quarterly newsletter title. So commentators and investors try to fit a narrative around every market sell-off.
More often than not, though, today’s narrative is tomorrow's fish and chip paper and the sell-off post mortem reveals that stocks just became a little too expensive.
As Ben Graham said, in the short-run stock prices succumb to popularity and their valuations disconnect with the actual long-term prospects of the firm.
What this means is that in the end stock prices will rise and fall with the prospects of the company. But in the near term, investors can get overly excited about those prospects and when that happens, stock prices can become disconnected from the underlying fundamentals and become overvalued.
Valuation overshoot corrections tend to have an epicentre where a particular sector, theme or style feels the worst of the pain due to becoming overextended in the first place.
January’s correction might turn out to be a classic valuation overshoot, especially for growth companies.
Just look at Netflix. The pandemic was a boon for the company as we all stayed at home and gorged ourselves on TV series. Investors got used to Netflix’s outsized growth and extrapolated into the future, driving up the share price and valuation at the same time.
A year or so on and Netflix's growth has slowed dramatically and its shares have undergone a classic valuation correction.
Read more: Will the market crash in 2022?
How long does it take to recover from a market correction
As we have said, each market correction is different. The table below shows all the selloffs of 10% or more since the financial crisis.
Note we have not included the 2022 correction. At the time of writing, we are not certain whether it has ended or not.
Past performance is not a reliable indicator of future returns.
Source: Koyfin 2022.
The speed of recoveries has been a feature of corrections since the financial crisis. The excesses built up ahead of the collapse in 2008 were extreme, and as financial markets were in the eye of the storm, it's not surprising that it took some time for them to recover.
But we shouldn’t assume that all future corrections will be short-lived. It took four years for the market to return to its high after the dot com bubble burst and found a floor.
But it stayed there for only a brief time before the credit crisis hit.
If we zoom out we could argue it took nearly 10 years for the S&P 500 to establish itself above its 1999 level, quite a different conclusion.
How to prepare your portfolio for a market correction
Generally it is not a good idea to try and time the market. Some investors like to hold cash as “dry powder” in the hope of picking up some bargains when markets fall.
But sitting with all that cash means it’s not in the market, earning growth and dividends of its own.
We suggest that cash should not form part of your investment portfolio.
Read more: How much cash should I have in my portfolio?
For one thing, inflation is running hot at 5.4% in the UK and the real value of cash will be eroded over time. For another, cash will be a drag on investment performance as markets rise and you’re waiting to go shopping.
The best thing to do is to focus on the long term, build a portfolio of well-diversified investments, and sit tight.
It might be a good idea to do some portfolio analysis to make sure you don’t have too much concentration risk around any one style, theme or factor. But that’s about preparation, not reaction. If you’re trying to plan to jump in at a precise moment, when it comes to corrections, if you blink, you could miss them.
Most investors are neither skilled nor nimble enough to pick tops and bottoms. Focusing on risks like the ones mentioned and building a portfolio of quality companies for the long run is the best defence against market corrections.
Download the Freetrade investment app and join over 1 million UK retail investors that trust us already.


.avif)


.avif)