
In this week’s earnings preview, we’re honing in on big banks as the US kicks off another round of quarterly updates.
Up first, we’re reviewing earnings updates from JPMorgan, Bank of America, and Goldman Sachs. We'll explain what differentiates the big banks and highlight key points of interest from their updates.
Beyond the banks, there’s a chance to take the pulse of the AI hardware sector as we preview ASML and TSMC earnings updates scheduled for later in the week. Finally, we’ll round things off with streaming giant Netflix.
JPMorgan
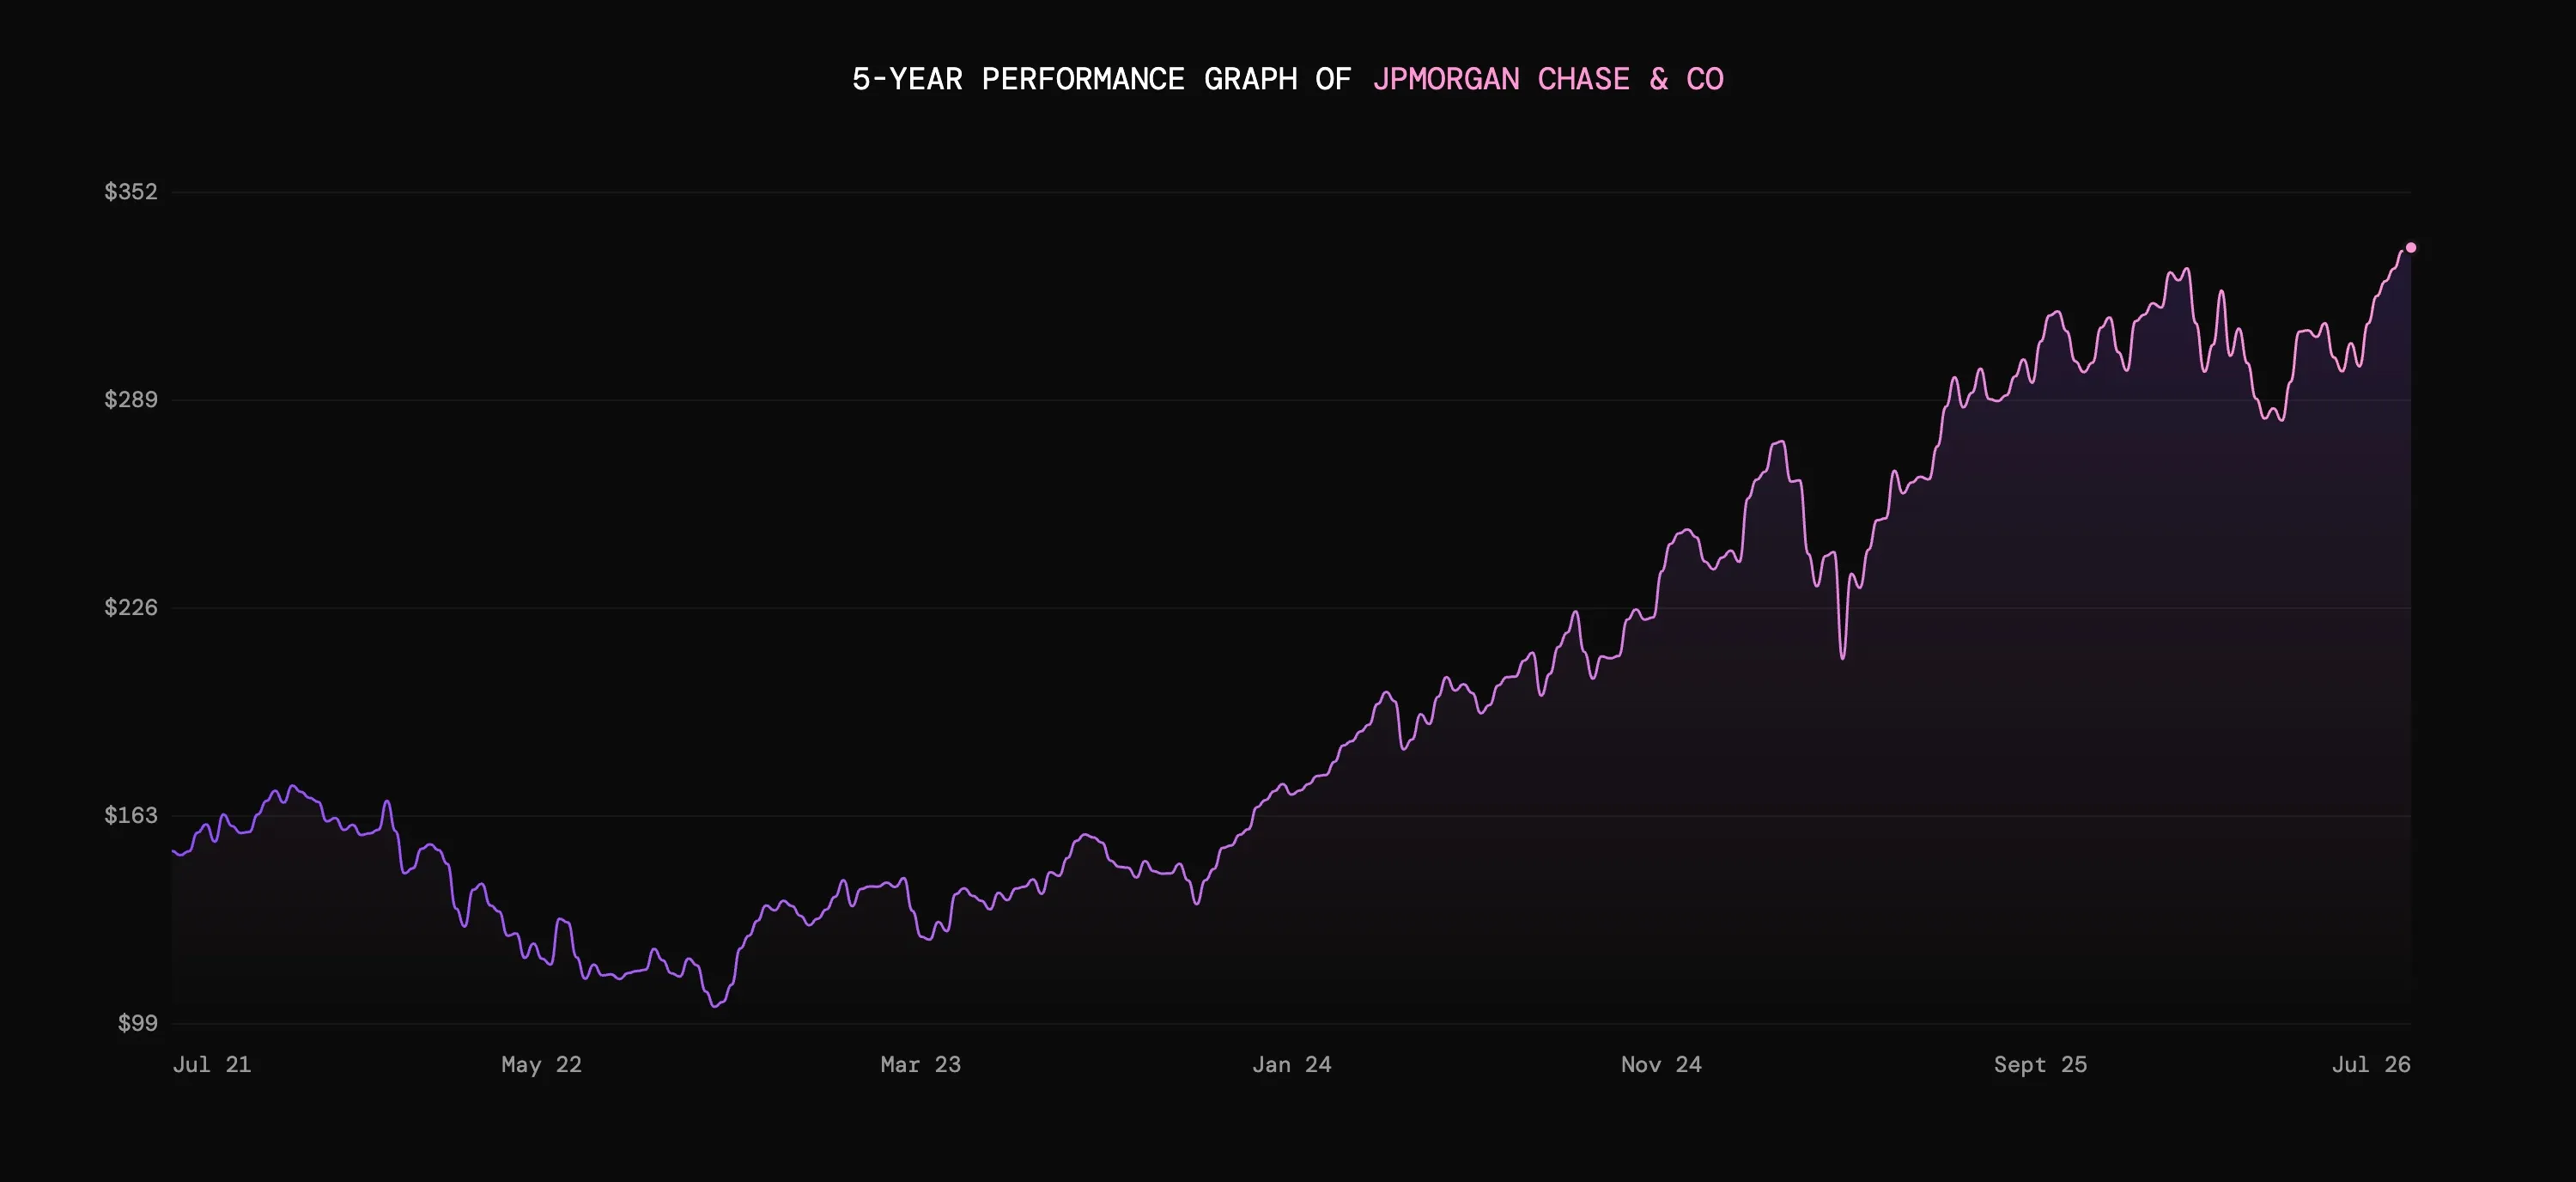
JPMorgan’s Q2 FY2026 earnings were released on Tuesday before the market opened.
According to Refinitiv data, consensus expectations were for the company to report quarterly revenue of $50.2bn and earnings per share (EPS) of $5.78. Revenue was well ahead of expectations, at $58.0bn, while EPS hit $7.70.
JPMorgan is the biggest bank on Wall Street by market capitalisation. It’s a key bellwether for the global banking sector, as well as consumer and corporate health.
Investment banking was the hot topic after a strong quarter for IPOs, mergers and acquisitions, and equity issuance.
JPMorgan’s broader Commercial & Investment Bank division is its largest revenue segment, delivering $24.9bn of net revenue, up 27% YoY. Within that, investment banking fees climbed 30%, helped by stronger advisory and equity-underwriting activity.
This helped to drive Q2 overall revenue 28% higher, and another active quarter may have seen the segment bear more fruit.
On the other side of the coin, the Consumer & Community Banking segment delivered more subdued 8% growth. Lower net interest income from Home Lending was a drag during the period, though Card Services & Auto net revenue notched double-digit YoY growth.
Looking toward broader market signals, attention is always on CEO Jamie Dimon’s two cents on the state of the US economy. He commented:
“The U.S. economy has demonstrated notable resiliency this year, with stronger business investment and hiring. This strength is being supported by several tailwinds, including AI-driven capital investment, fiscal stimulus and the benefits of more efficient regulation. However, several risks are shifting below the surface.”
Credit quality offers additional insight here. Overall provision for credit losses, which is how much a bank holds to compensate for loan defaults, bad debts, and other credit risks, remained largely flat.
However, provision within the consumer banking business was marginally higher, up to $2.2bn, as higher net charge offs were driven by card services. The US economy might be resilient, but perhaps some consumers are feeling the squeeze.
A rebound in corporate dealmaking and fundraising led to a bumper quarter for JPMorgan, but will its less explosive segments limit its growth?
Bank of America
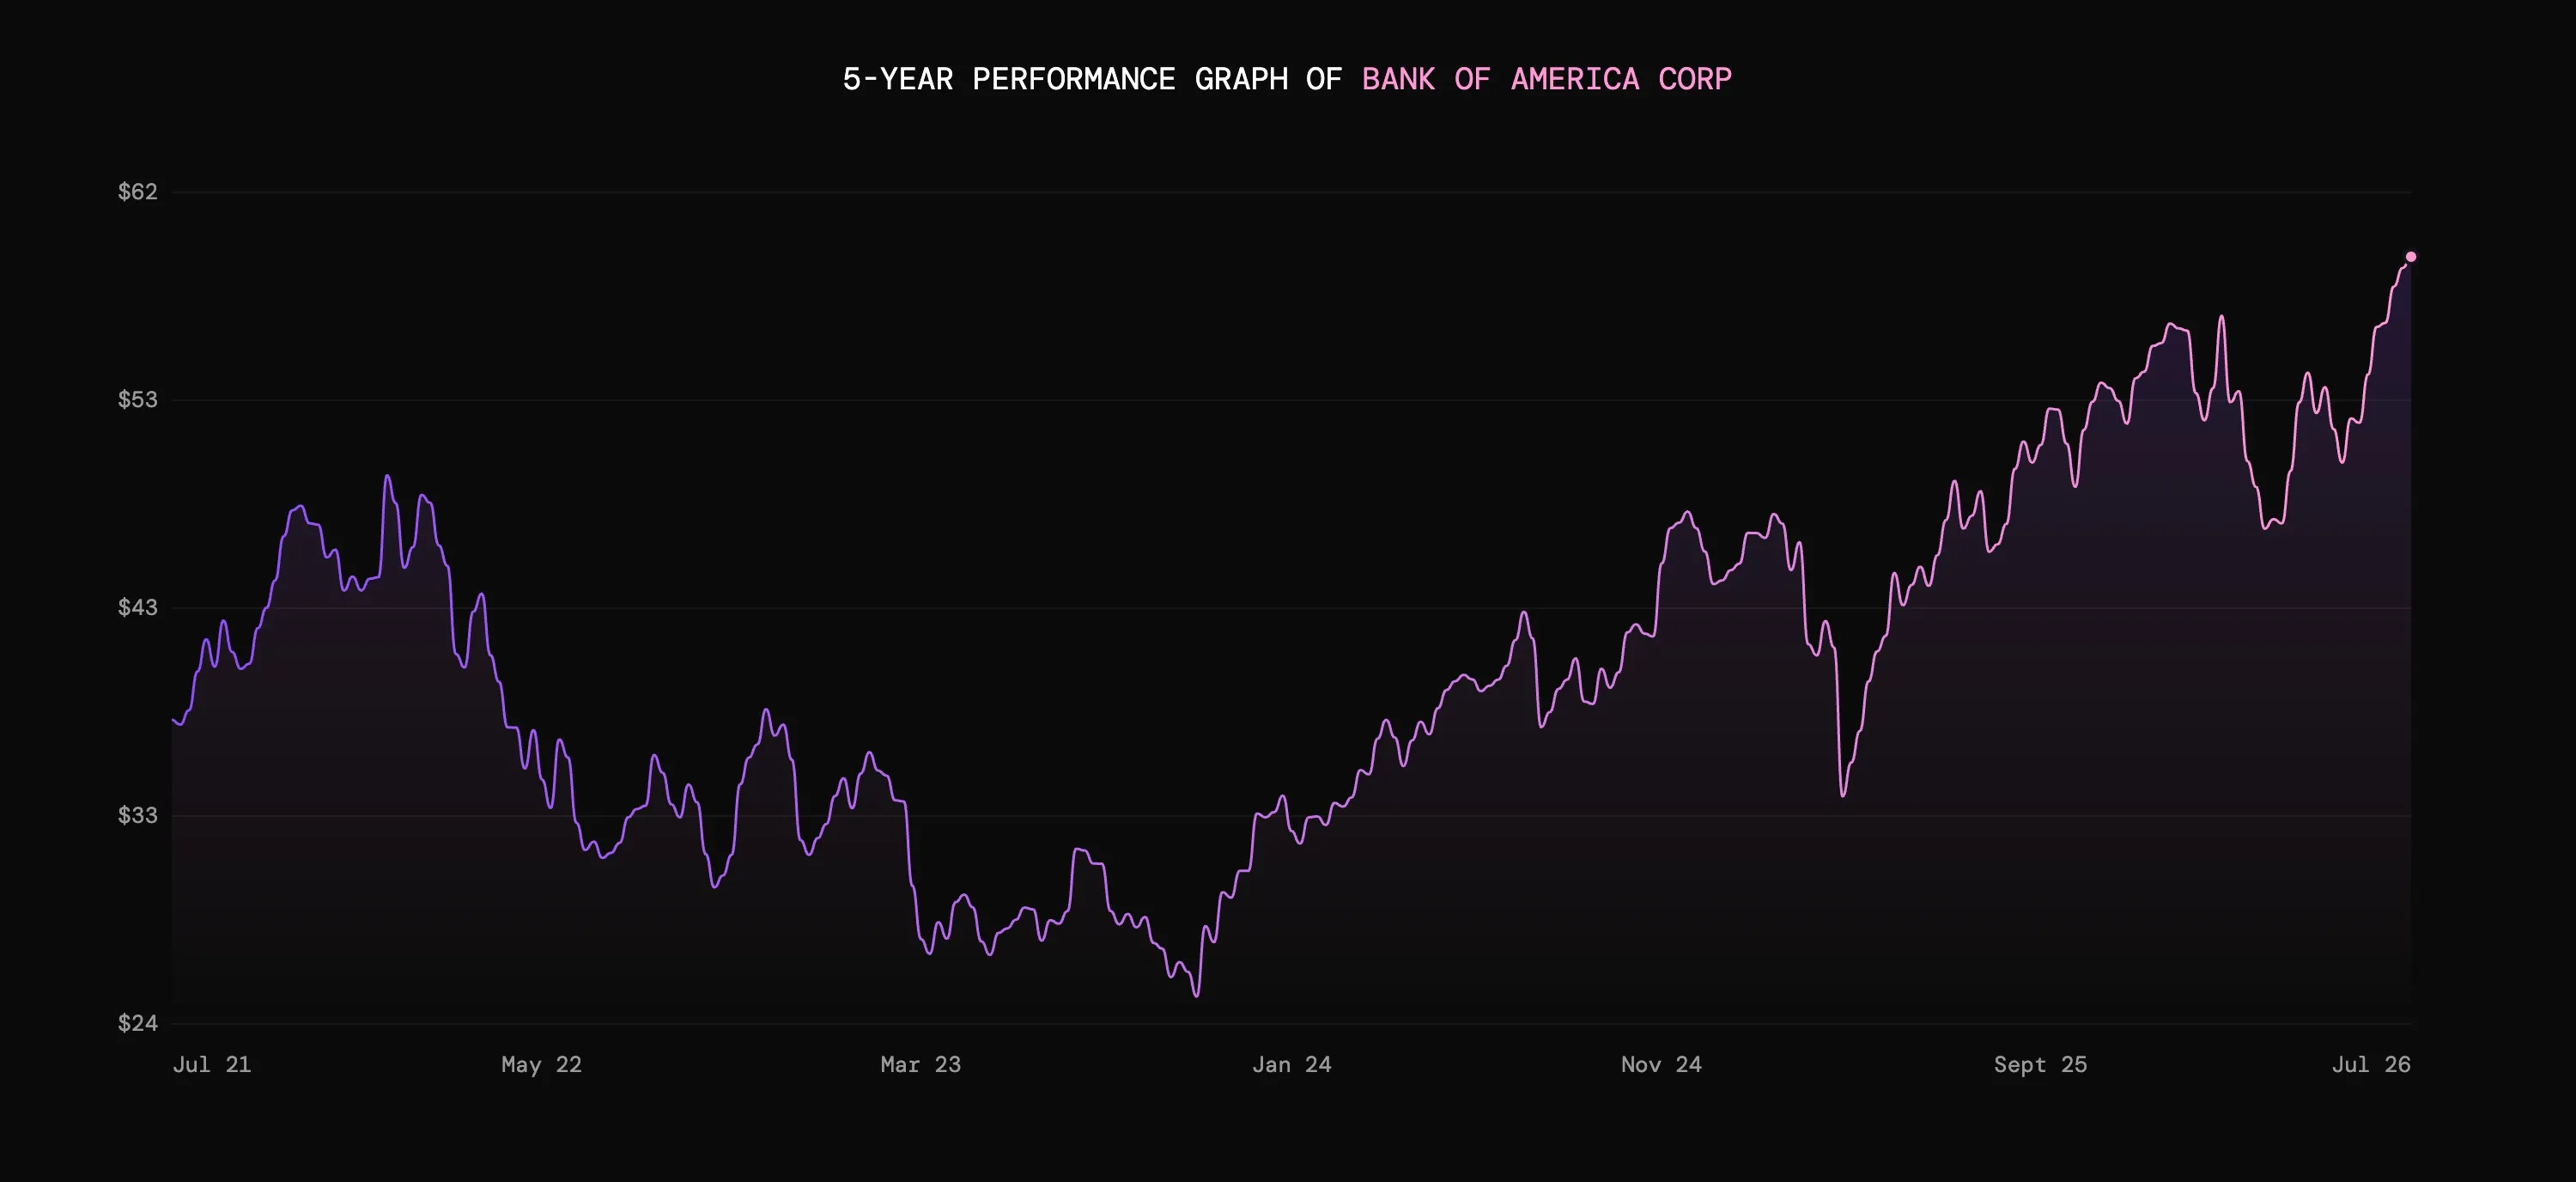
Bank of America’s Q2 FY2026 earnings also released before the market opened on Tuesday.
According to data from Refinitiv, the company was expected to report revenue of $30.7bn and EPS of $1.13. It also topped expectations, reporting quarterly revenue of $31.6bn and diluted EPS at $1.21.
Bank of America is one of the country’s largest retail banks, and is more closely tied to the health of the nation’s consumers. It therefore offers more of a consumer-focused angle than the other rivals previewed here, with insights on household borrowing and savings.
If you are looking for these broader insights, credit quality should be your first port of call as they tell us more about consumer resilience. Provisions for credit losses was flat QoQ, and card delinquencies improved for a fifth consecutive quarter.
Net interest income is another headline number to follow. This reflects the difference between the interest Bank of America earns from loans and investments, versus what it pays out to depositors.
It’s also a crucial measure of Bank of America’s fortunes.
Net interest income climbed 9% YoY to $16.0bn as the impact of higher deposit and loan balances outweighed lower interest rates. In the Consumer Banking segment, revenue rose by 5%, and was primarily driven by net interest income.
But this steady performance from the largest portion of the business wasn’t the main driver behind Bank of America’s 15% total revenue growth.
The Consumer Banking segment might be Bank of America’s bread and butter, but the business’s rapidly growing Global Wealth and Investment Management arm is also worth a watch. Revenue grew by 16% to $6.9bn as higher asset management fees, growth in client balances, and an uptick in AUM provided a boost.
Stronger capital-markets activity was the source for another boost, with Bank of America’s investment banking fees of $2.1bn up by 50% YoY. It might have a consumer focus, but the business undoubtedly benefitted from more dealmaking and other corporate actions in Q2.
But is the growth delivered by rising net interest income and stronger dealmaking sustainable, or will pressure start to tell on the consumers Bank of America relies upon?
Goldman Sachs
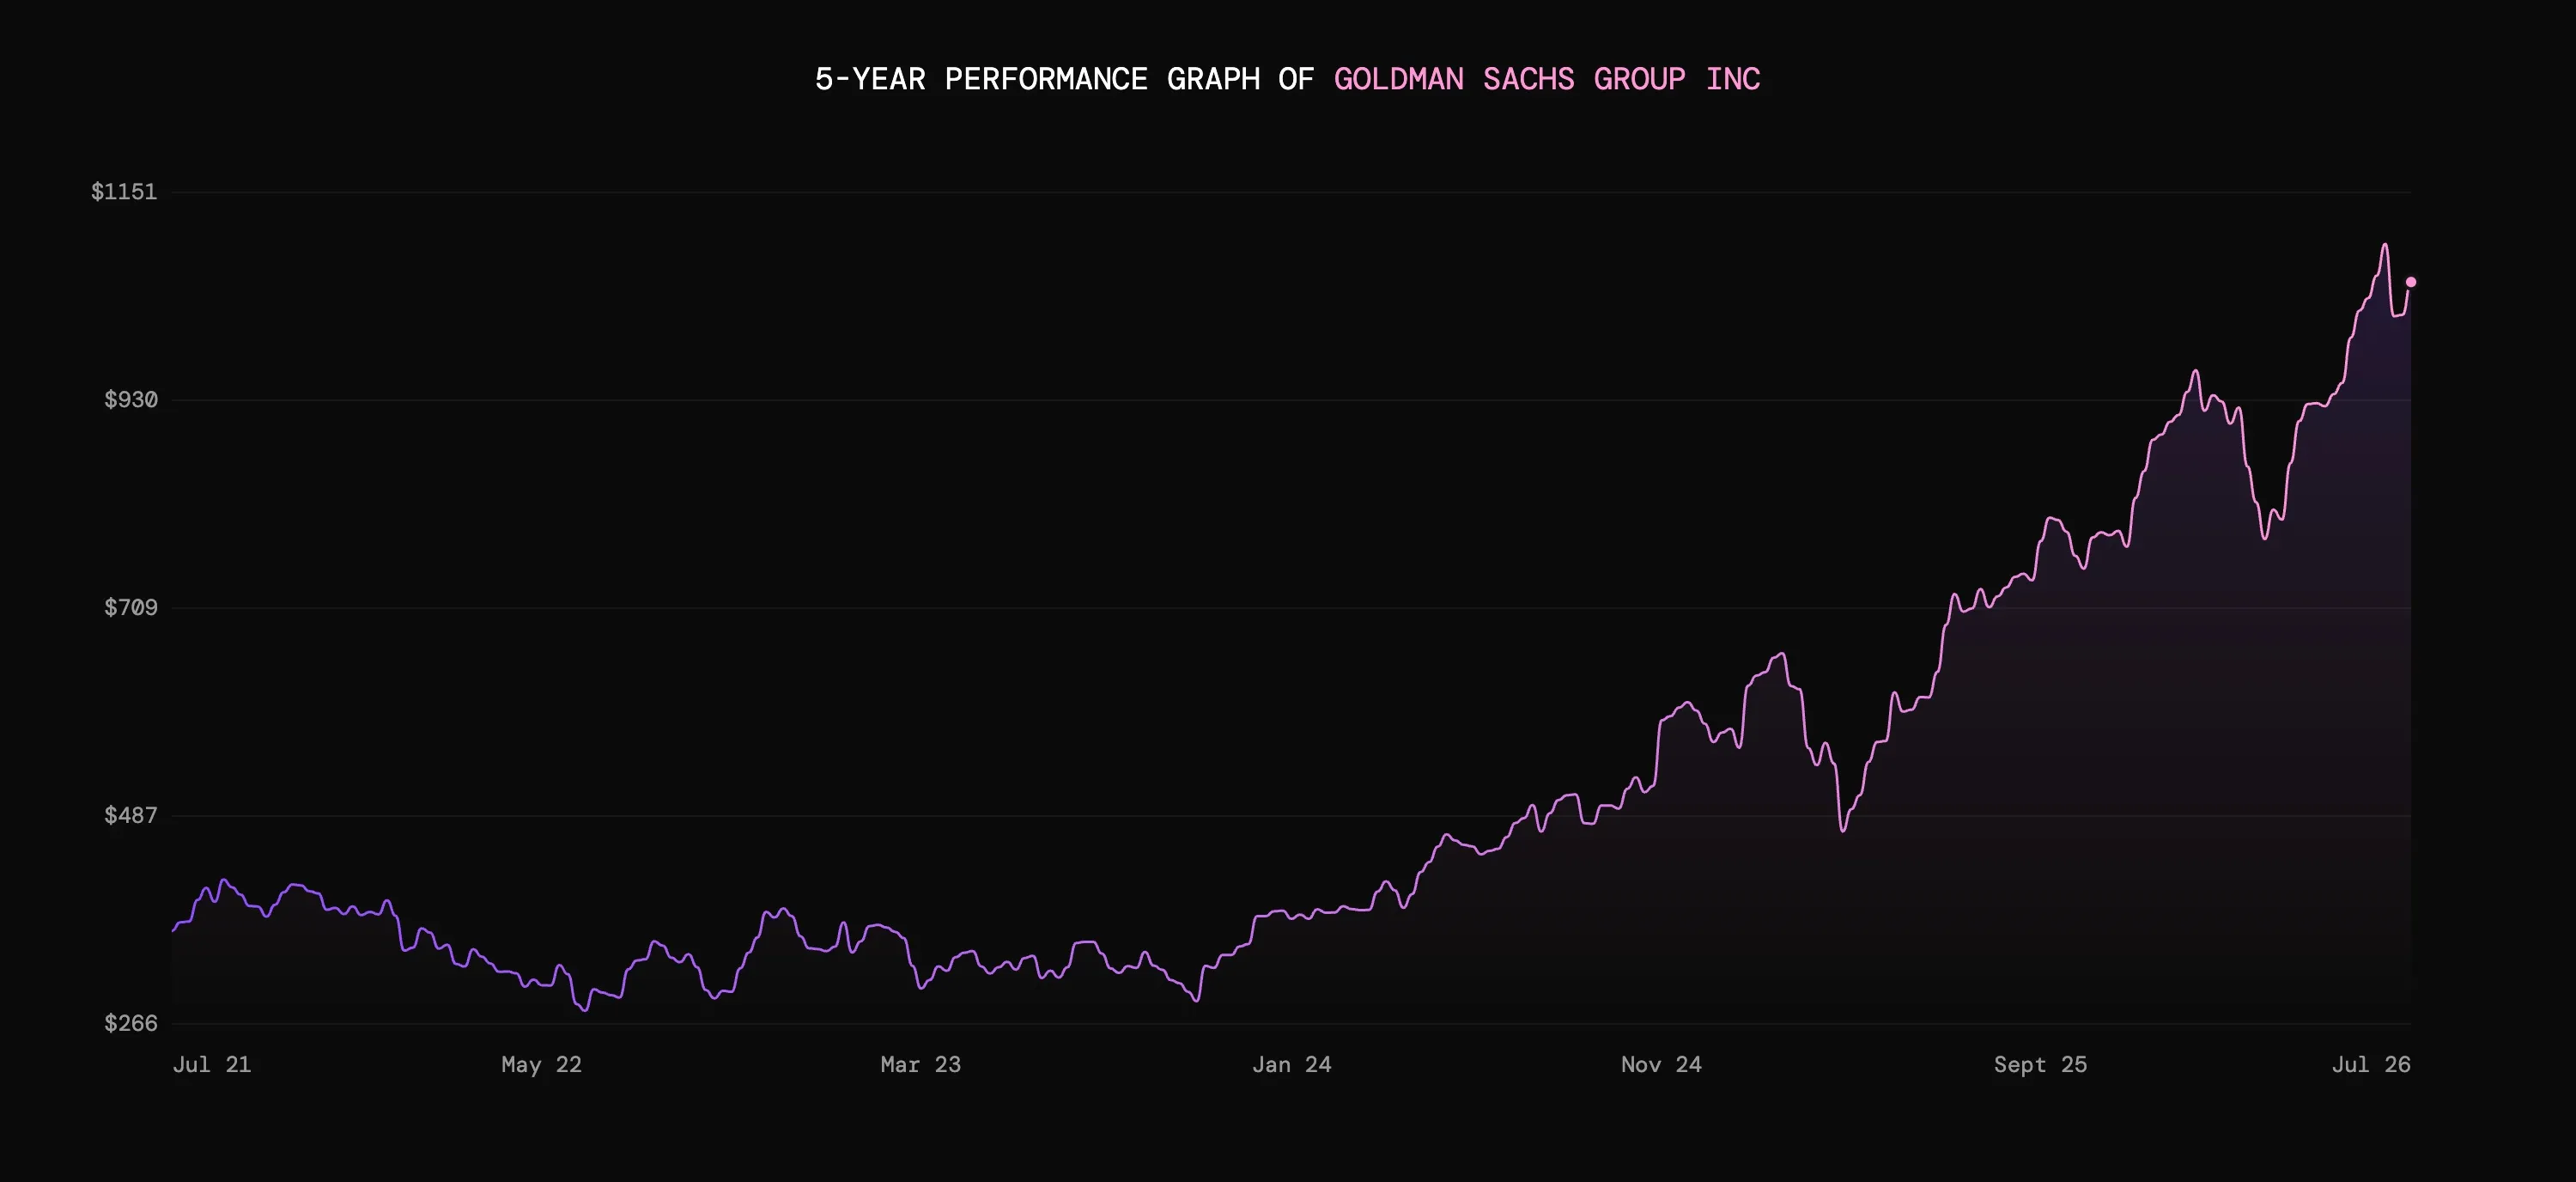
Goldman Sachs also reported its Q2 FY2026 earnings before the US market opened on Tuesday.
According to Refinitiv data, Goldman Sachs was expected to report quarterly revenue of $16.1bn and EPS of $14.48. Like its contemporaries, Goldman Sachs scored an earnings beat as it registered record quarterly profits. Revenue was $20.3bn, while EPS was £20.98.
While JPMorgan is Wall Street’s biggest fish, and Bank of America offers the consumer angle, Goldman Sachs’s results are heavily linked to global capital markets, corporate confidence, and investor activity.
In short, among the big US banks, it offers investors the purest play on Wall Street activity.
Revenue climbed by 39% to $20.3bn, largely driven by major growth from Global Banking & Markets. This is comfortably the bank’s largest division, and generated $15.5bn of revenue during the period, up 53% YoY. Within that, investment-banking fees surged 55% YoY to $3.4bn, helped by stronger M&A advisory activity and equity underwriting.
We have already mentioned the increase in IPOs, corporate fundraising and M&A during Q2. Goldman’s position as a major deal adviser means it could be particularly well placed to see sustained momentum. For example, the firm took a leading role in the enormous SpaceX IPO in June.
Trading has also been a major revenue source within the division. In Q2, equities revenue of $7.4bn represented 72% YoY growth. Meanwhile fixed income, currencies and commodities (FICC) revenue rose by 32% to $4.6bn, having been a tricky spot for the business in recent quarters.
The S&P500 and Nasdaq 100 enjoyed their strongest quarters in six years, offering a supportive backdrop for equities trading. FICC’s lot was a bit more complicated. Geopolitical tensions and commodity price movements have created considerable uncertainty, though uncertainty can also stimulate trading.
However, one kink to keep an eye on going forward is the firm’s operating expenses.
These rose by 26% to $11.7bn, partly reflecting higher compensation linked to stronger revenues. In H1, the bank’s efficiency ratio improved to 58.8%, meaning it spent just under 60 cents to generate every dollar of revenue.
However, the rapid increase in expenses could spook investors if there are signs Goldman’s growth will not be able to absorb it.
Lively financial markets helped Goldman Sachs deliver a record quarter, but higher costs and demanding expectations may end up taking some of the shine off performance.
ASML
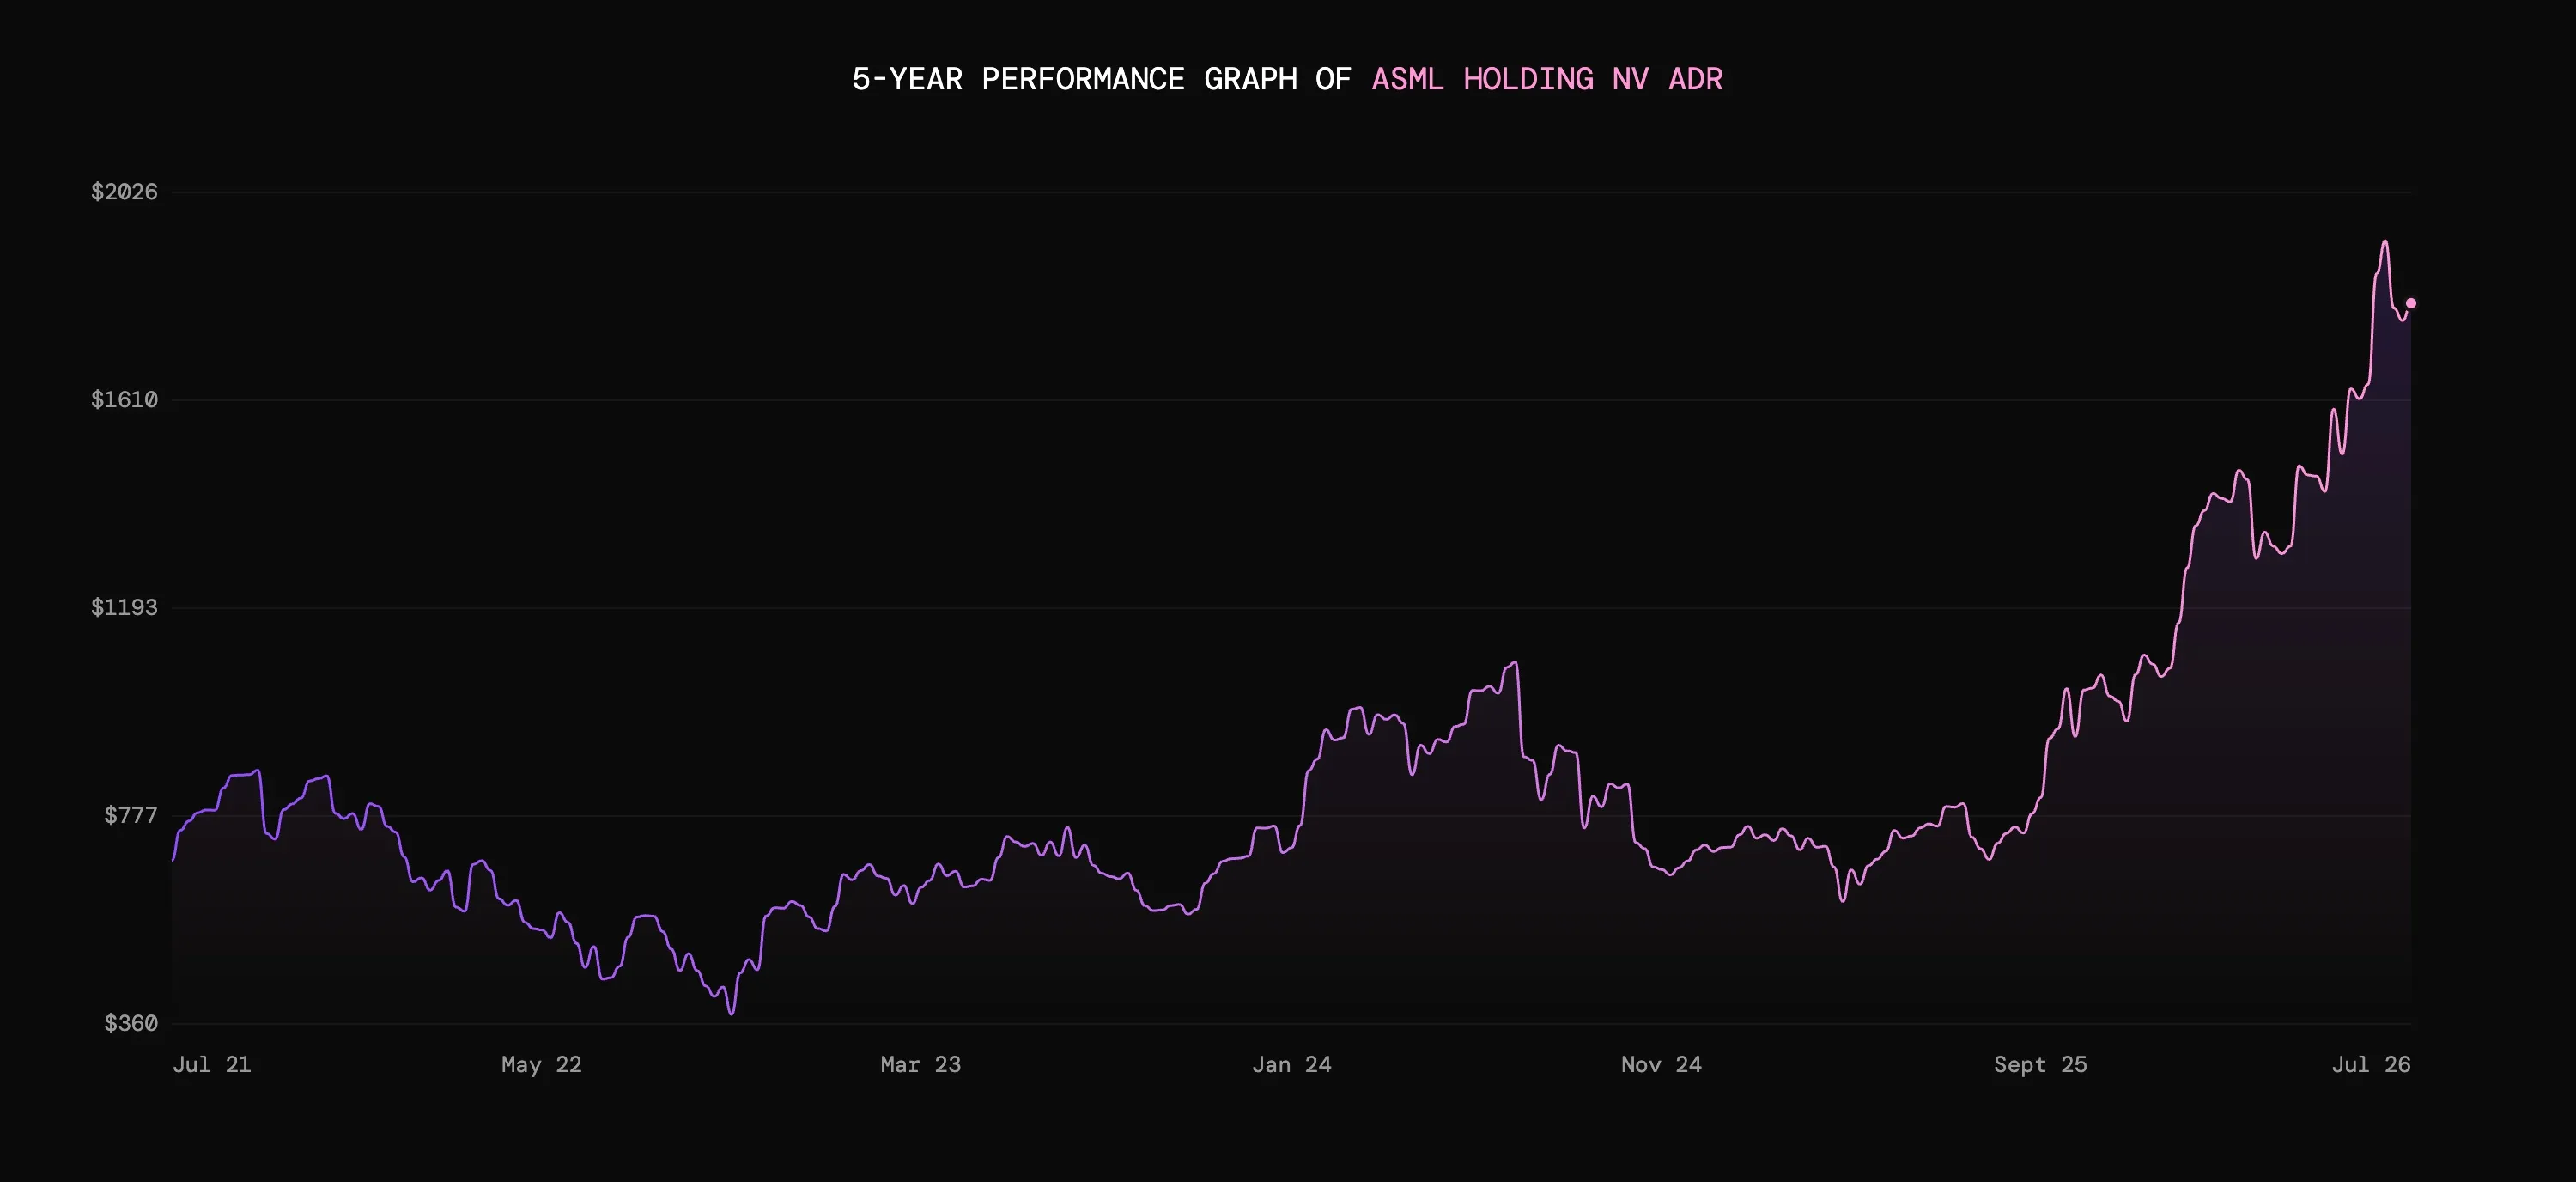
While ASML is listed on the Nasdaq, its dual listing on the Euronext Amsterdam means its Q2 FY2026 earnings release will be before the European market opens on Wednesday.
Data from Refinitiv shows consensus expectations are for revenue of €8.8bn and EPS of €6.78.
The Dutch company is the world’s most advanced manufacturer of lithography machines, and the only company capable of creating the Extreme Ultraviolet (EUV) lithography systems needed to construct advanced semiconductors, like those purpose-built for AI applications.
This has made ASML one of the clearest beneficiaries of the AI infrastructure boom. Back in Q1, net sales climbed by around 14% YoY to €8.8bn, while EPS reached €7.15.
Right now, everyone is looking for a read on the sustainability of the AI chip wave. For visibility on that, there are few better metrics than ASML’s net bookings. These stood at €5.6bn back in Q1.
If they fail to live up to expectations, investors may interpret this as limited demand from chipmakers TSMC, Intel, Samsung, Micron et al. To put it plainly, this would be bad news, not just for ASML, but for sentiment across the AI hardware sector.
Even so, bookings figures are worth taking with a pinch of salt. ASML’s machines are extremely expensive, costing as much as $400m each. This means small changes in customer orders can have an outsize effect on the metric.
Another key signal is the proportion of sales from China. It accounted for 27% of Q1 system sales, significantly lower than in 2025 as export restrictions weighed. Investors will want to know whether that trend continued and whether other regions are picking up the slack.
Will ASML’s update expose cracks in the semiconductor investment boom, or give the AI trade a shot in the arm?
TSMC
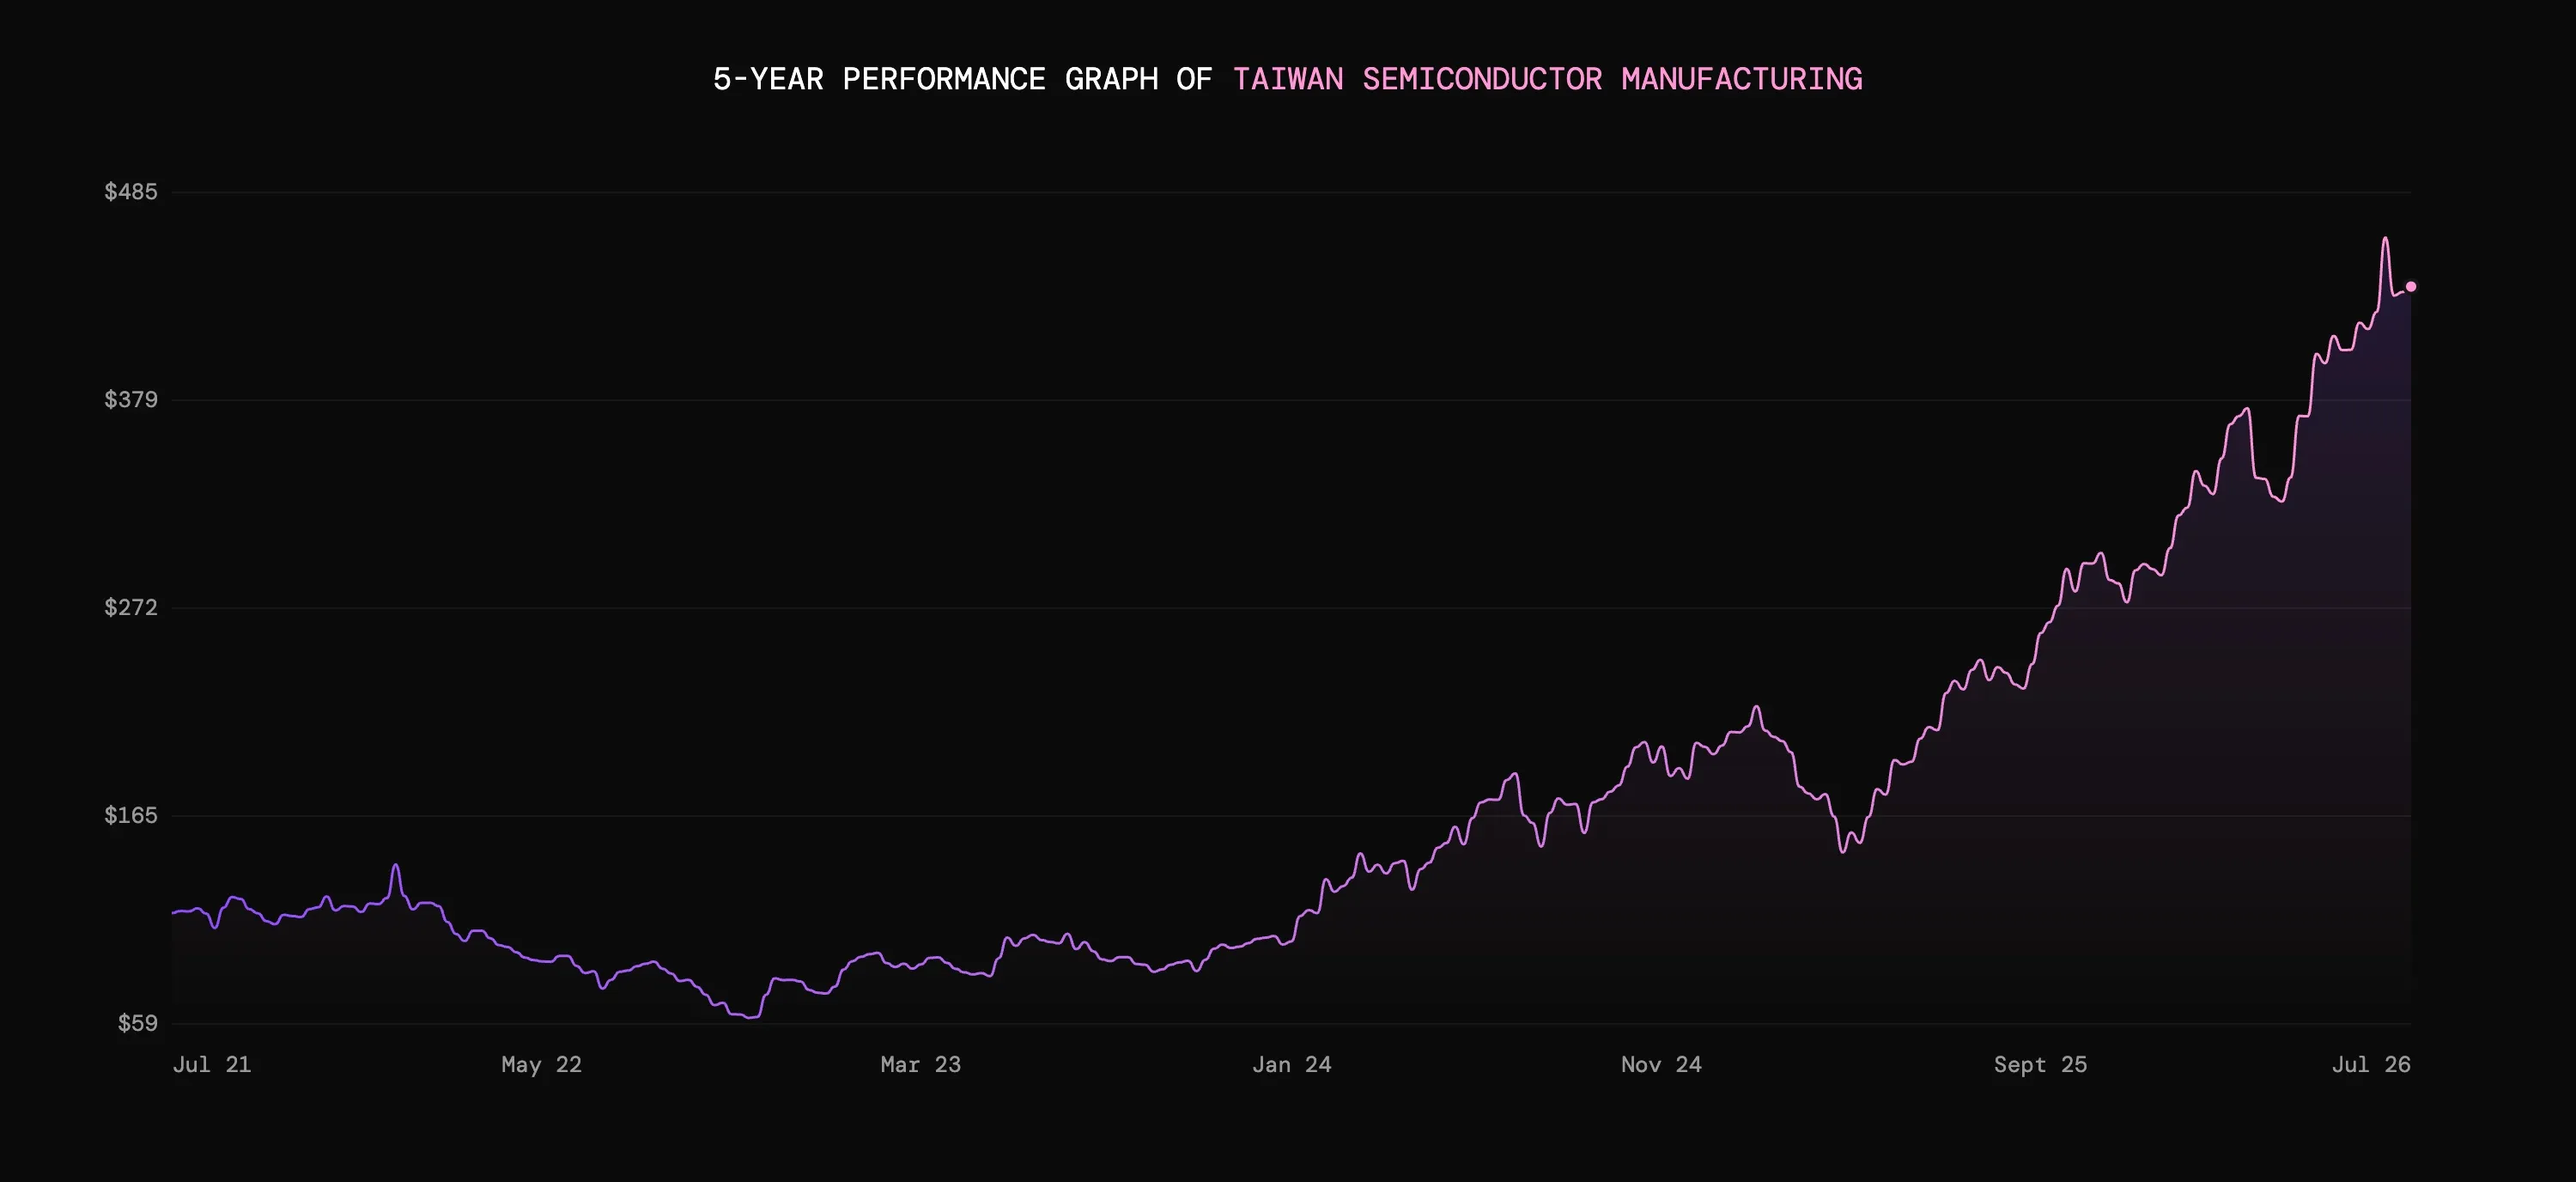
Following swiftly on is TSMC, which reports its own Q2 FY2026 earnings before the US market opens on Thursday.
Refinitiv data shows consensus analyst estimates have its Q2 revenue pegged at $39.0bn and EPS at $3.81.
TSMC manufactures the chips designed by companies like Nvidia, AMD, Apple and Broadcom. The business has a massive 73% share of the global pure-foundry market, according to Counterpoint Research.
Companies feed in their blueprints, and TSMC churns out the chips.
Like ASML then, the business is a gauge of AI hardware investment.
Momentum was strong in Q1, when revenue rose 40.6% YoY to $35.9bn and gross margin reached 66.2%. High-performance computing, which includes AI and data-centre chips, accounted for 61% of sales.
We already have some fairly clear signals of where Q2 will land.
That’s because TSMC published its June sales on Monday, completing a quarter in which revenue rose by around 36% YoY. June revenue alone leapt 67.9%.
Of course, revenue is not the whole story. Sales are the result of massive demand, and the business is having to invest heavily to meet that demand and retain its dominant position.
With quarterly sales already known, profitability is the missing piece of the puzzle. Overseas expansion and freshening up manufacturing tech may weigh on margins. Management previously guided for a Q2 gross margin of between 65.5% and 67.5%, and investors could punish any shortfall.
So, will surging revenue keep investors interested, or will the cost of expansion begin to chip away at margins?
Netflix
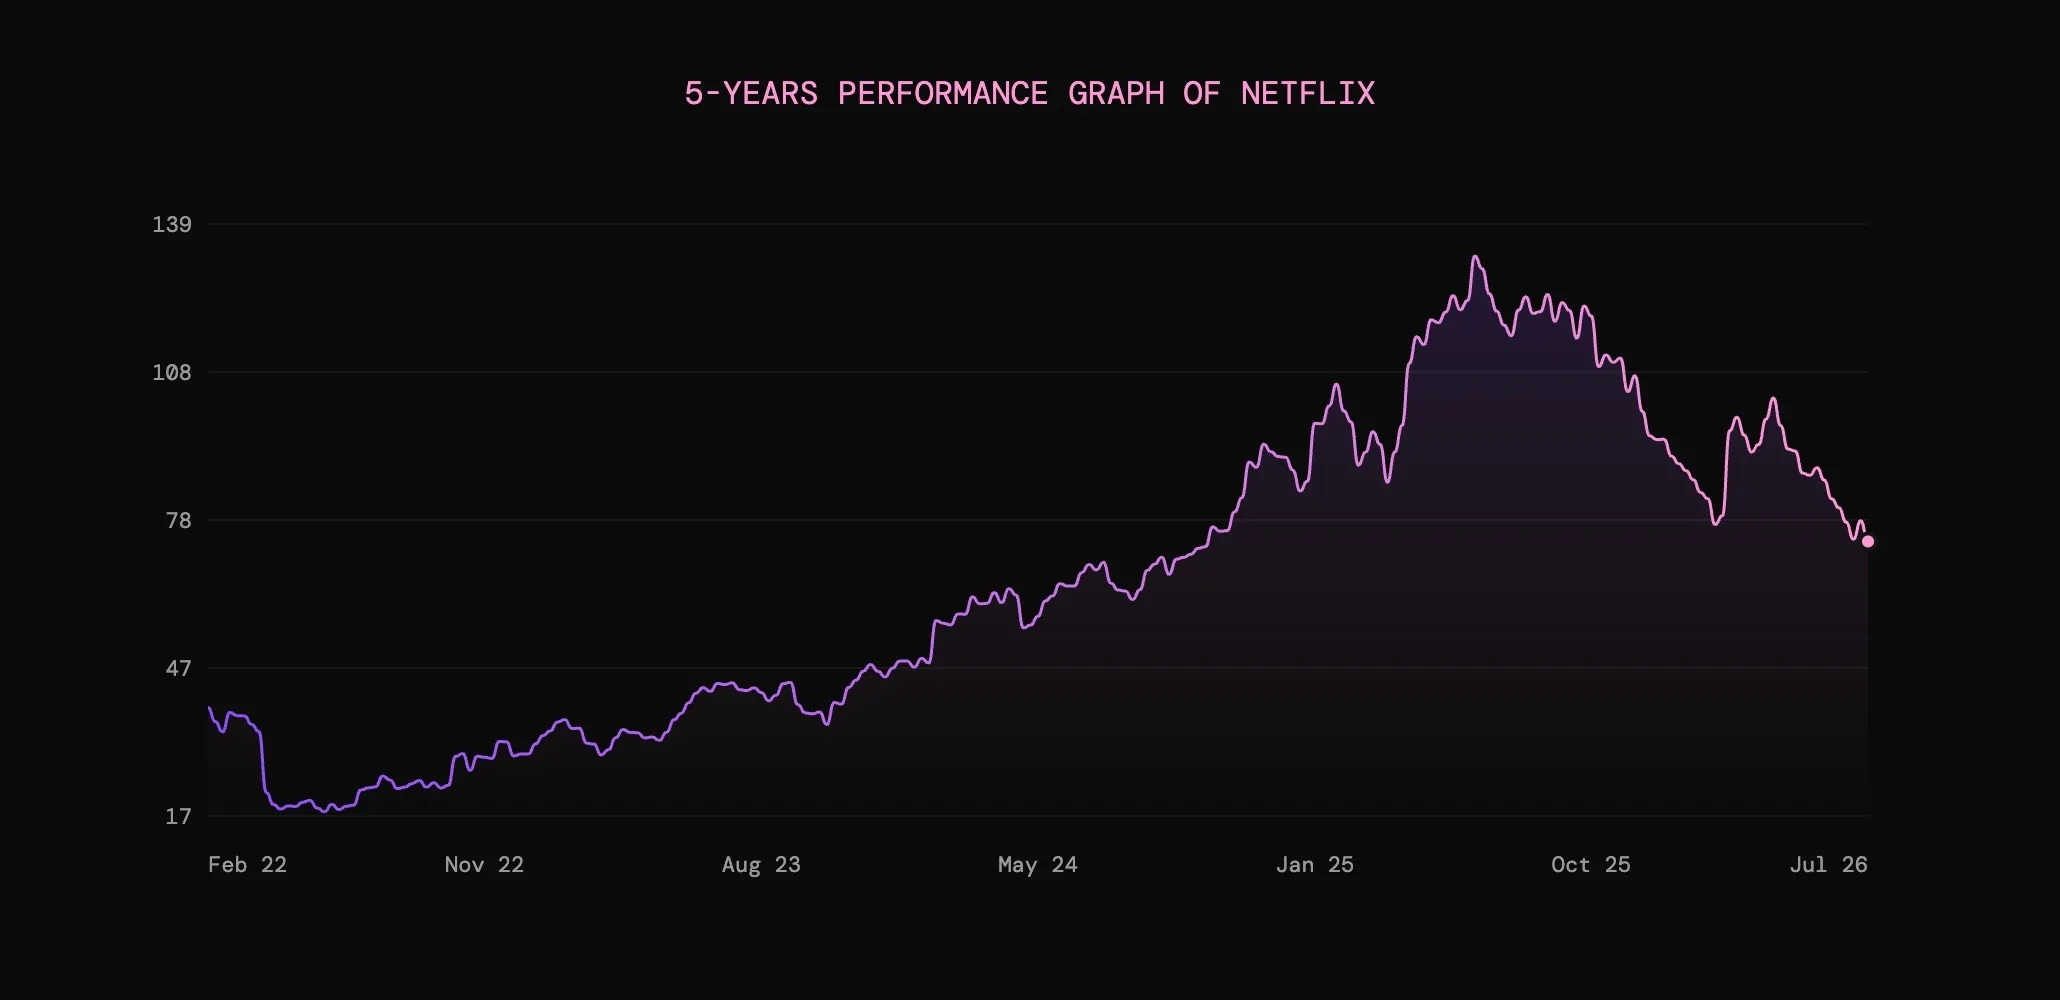
Rounding off the week, Netflix is set to release its Q2 FY2026 earnings after the US market closes on Thursday.
Refinitiv data currently shows consensus analyst expectations for revenue of $12.6bn and EPS at $0.79.
The streaming giant entered the period in a position of strength. In Q1, revenue climbed by 16.2% YoY to $12.3bn, while a 60 basis point improvement in operating margin to 32.3% further aided improved profitability.
The streaming battle is red hot right now. Legacy media giants like Disney possess massive libraries of much-loved content and popular IPs, while deep-pocketed technology players like Alphabet, Apple, and Amazon continue to invest heavily in streaming.
As a streaming pure-play, Netflix can’t afford to lose the fight for on-screen supremacy.
With around 325 million paid memberships globally and an audience approaching one billion people, Netflix has decided winning this fight is less about adding subscribers at breakneck speed and more about earning more from each customer.
Competing in this way demands quality content, and Netflix has dug deep to deliver a broader variety to viewers, including an unprecedented push into live sports and entertainment.
While Netflix no longer reports subscriber numbers, this strategy seems to have strengthened engagement over recent quarters.
But the strategy comes with a price tag, and costs will be under the microscope.
Netflix already highlighted that Q2 is likely to have the highest year-over-year content amortization growth rate in 2026 due to the timing of new original releases. Operating margin is therefore forecasted at 32.6%, down from last year’s 34.1%.
Next, let’s look at audience monetisation, a key part of Netflix’s strategy.
Subscription fees are higher, and ad revenue is anticipated to double in size across 2026 and contribute roughly $3bn to revenue. That reduces the company’s reliance on pure subscription revenue, but it’s still some way off parity.
Of course, jacking up prices and selling ad space only works if viewers continue to see value in Netflix’s offering. While we no longer get official subscriber numbers from Netflix, the company's full-year guidance assumes continued healthy membership growth and so we may get some informal commentary.
In addition, Netflix says its “primary internal quality engagement metric” hit all-time highs in Q1. Healthy engagement is essential for the platform’s retention, pricing power, and advertising inventory. In lieu of official subscriber numbers, any info about improvement or deterioration will draw focus from investors.
Will stronger pricing and rapid advertising growth keep Netflix’s revenue moving higher, or will we find subscribers have been changing the channel despite rising content costs?
Capital at risk. The value of your investments can go down as well as up and you may get back less than you invest.
Fluctuations in foreign exchange rates may affect investments denominated in currencies other than GBP and the amount you receive back.
Past performance is not a reliable indicator of future returns.
Freetrade does not give investment advice and you are responsible for making your own investment decisions. If you are unsure about what is right for you, you should seek professional advice.
Always do your own research.

.webp)
.webp)
.webp)


.webp)